Concentrated Solar Power
SOLAR POWERED
LOCATION
DATA ACQUISITION (NATURAL RESOURCE)
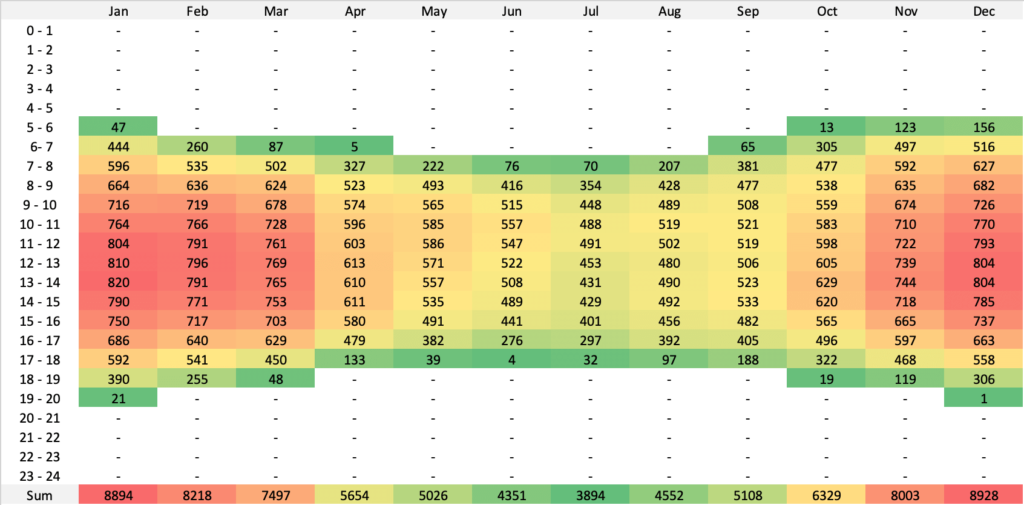
Fig. 1: Hourly averaged daily DNI data (Y2019)
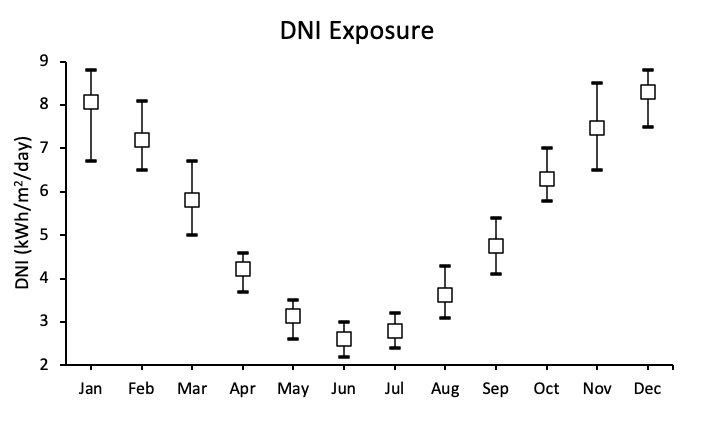
Fig. 2: Monthly averaged daily DNI data (Y1990 – Y2020)
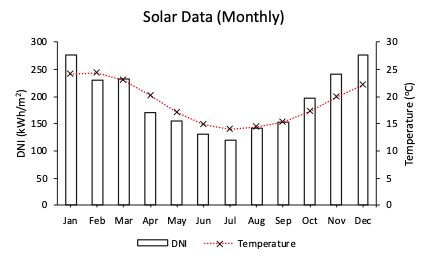
Fig. 3: Averaged monthly Solar data (Y2019)
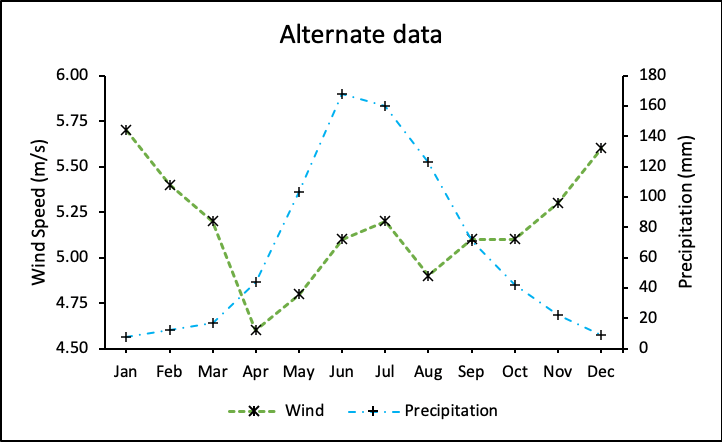
Fig. 4: Wind Speed and precipitation (Y2019)
DATA ACQUISITION (GRID)
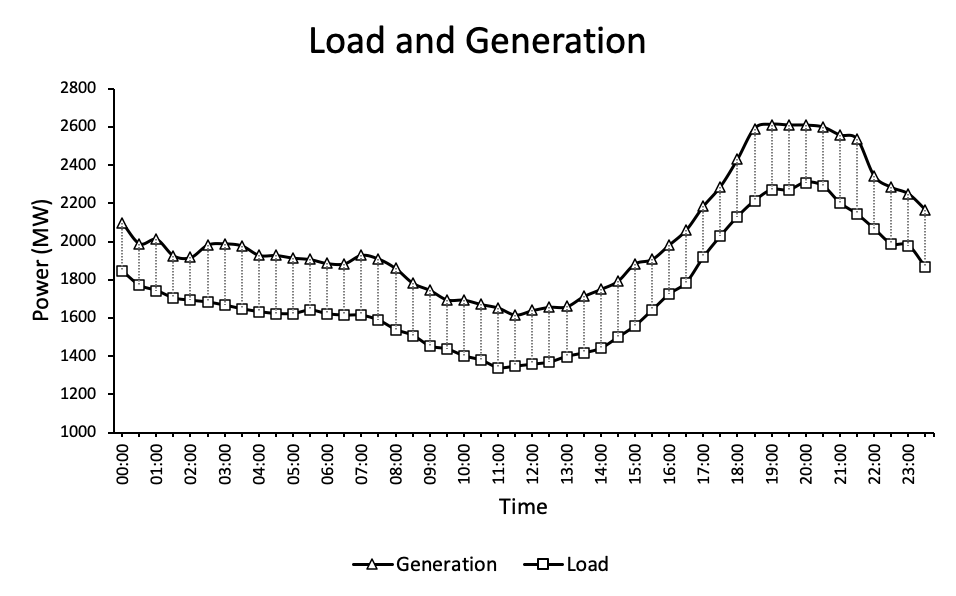
Fig. 5: Hourly profile for grid load and generation
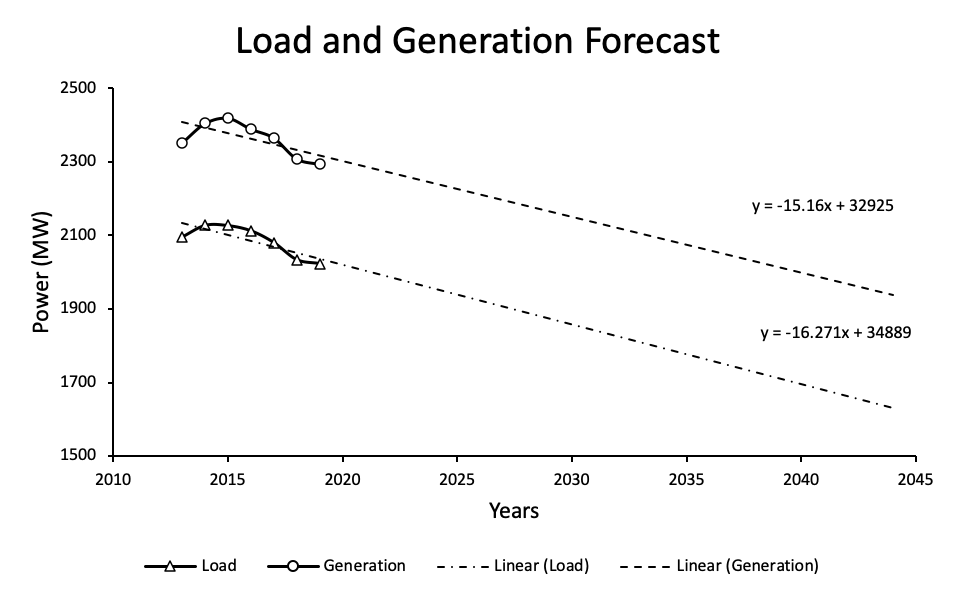
Fig. 6: Grid Load and generation profile forecast
TECHNICAL DESIGN & SIZING
System Design Summary
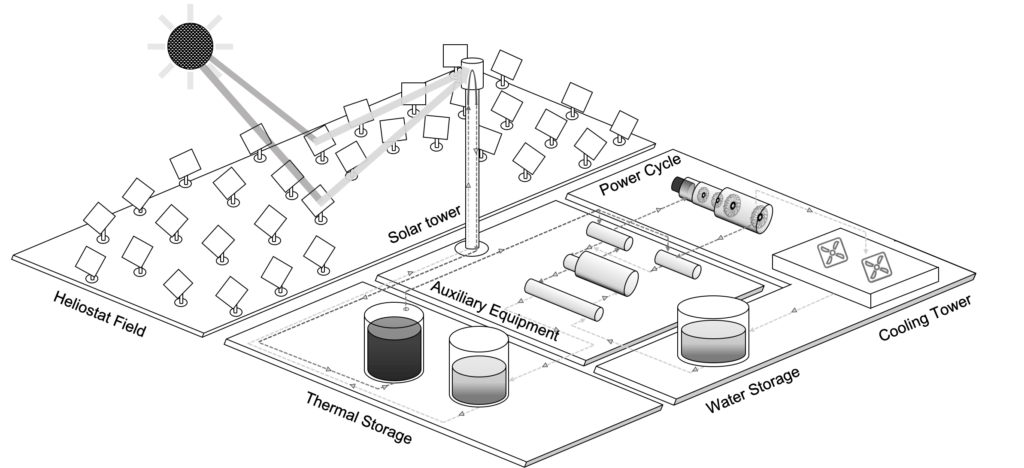
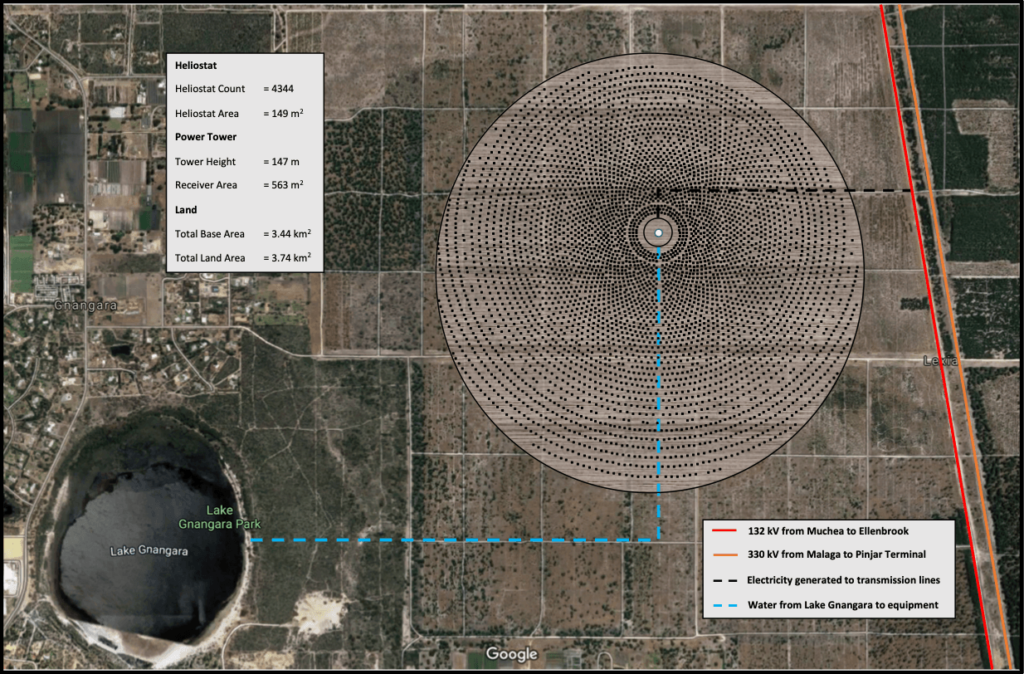
Fig. 7: System layout of CSP
The system comprises of a large array of heliostats which are arranged in a radial staggered layout. The thermal energy is concentrated on to a receiver placed at the top of a tower which holds solar salt, which is a mixture of NaNO3 (60%) and KNO3 (40%). This salt mixture is heated up to a temperature of 574oC. This is transferred by the use of vertical pumps to a hot salt storage tank, which is then dispatched to heat exchangers depending on the quantity of energy to be generated. The salt exchanges heat with water to convert it into steam which in turn is used to run the turbine-generator. The hot salt which is now cooled through the heat exchange process is then sent over to a cold salt storage tank
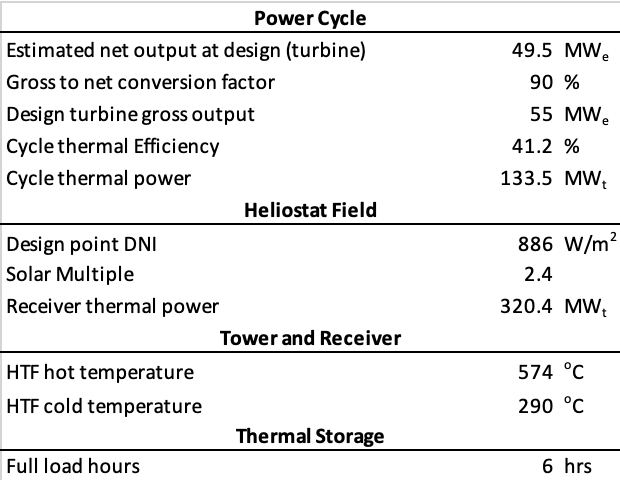
Fig. 9: System layout of CSP
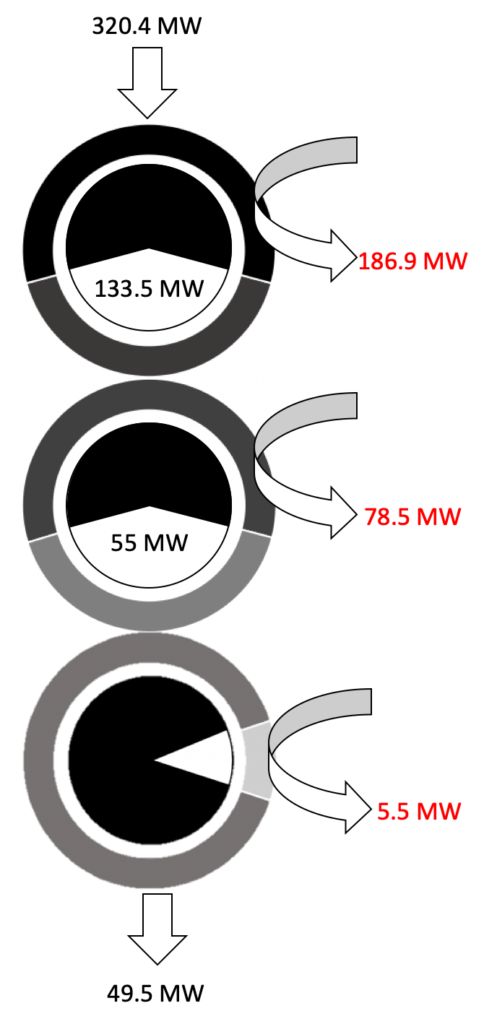
Fig. 10: Conversion losses
Heliostats
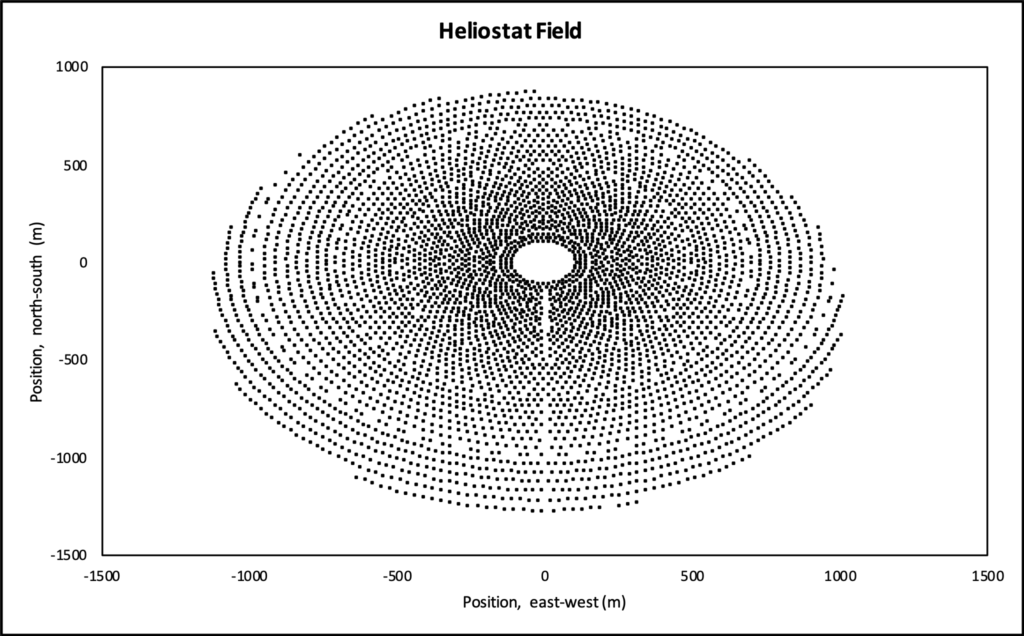
Fig. 11: Radial staggered layout with 4434 mirrors (640,000 m2) simulated using SolarPILOT
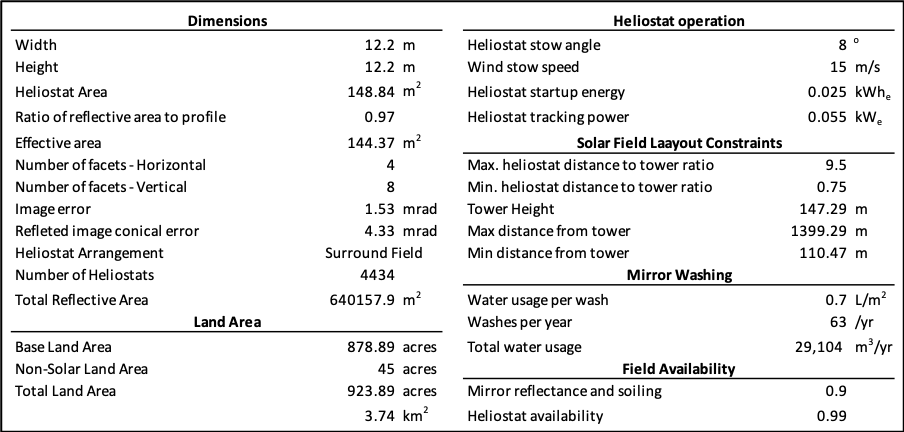
Fig. 12: Radial staggered layout with 4434 mirrors (640,000 m2) simulated using SolarPILOT
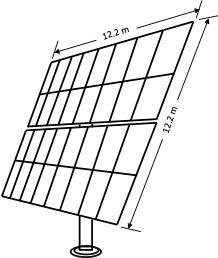
Fig. 13: Selected Heliostat
Heliostats form the central part of the collector subsystem. They are mirrors which are mounted on an axis to alter the angle and concentrate sunlight to one spot. Currently, there are two main options, first being glass-metal heliostats and the second being a stressed membrane. Although stressed membranes have been shown to have better cost savings although it is still not a mature enough technology. Additionally, it is not ideal for high wind loads and is not available for simulation using software packages. Hence, the glass-metal type is chosen for this project
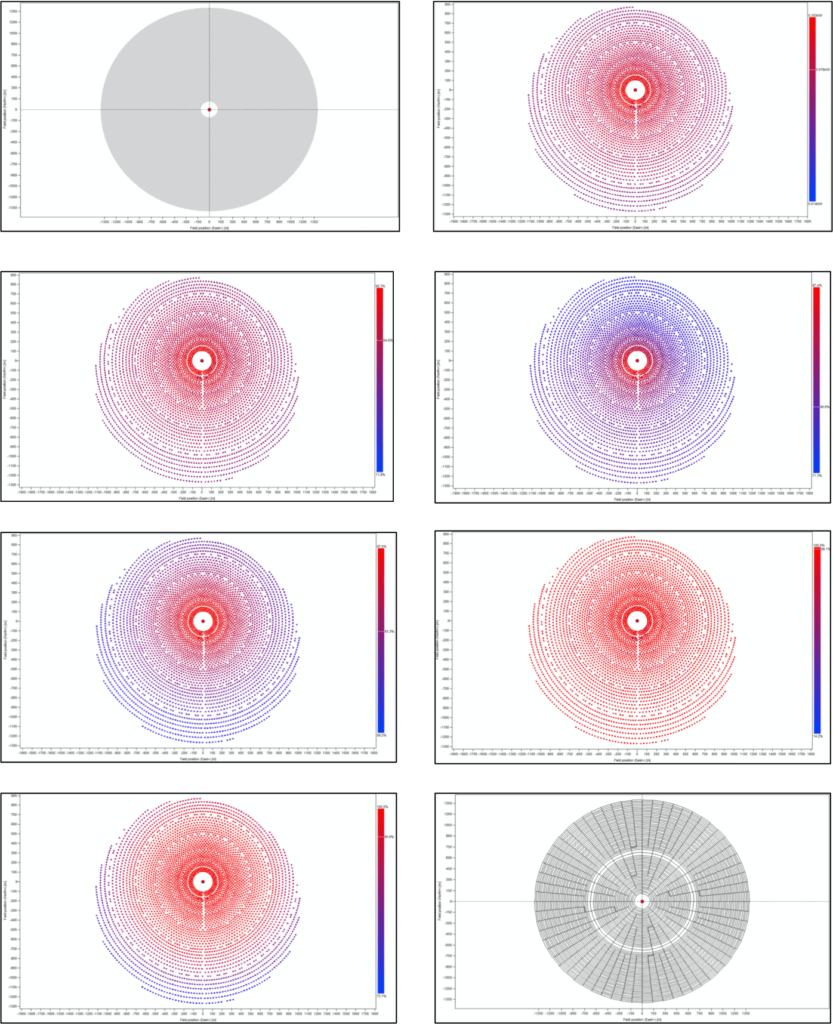
Fig. 14: Output from SolarPILOT after optimisation: (a) Land Boundaries defined, (b) Delivered power (kWt/m2), (c) Total Efficiency (%), (d) Cosine Efficiency (%), (e) Attenuation efficiency (%), (f) Blocking Efficiency (%), (g) Image intercept efficiency (%), (h) Optical Mesh
Tower & Receiver
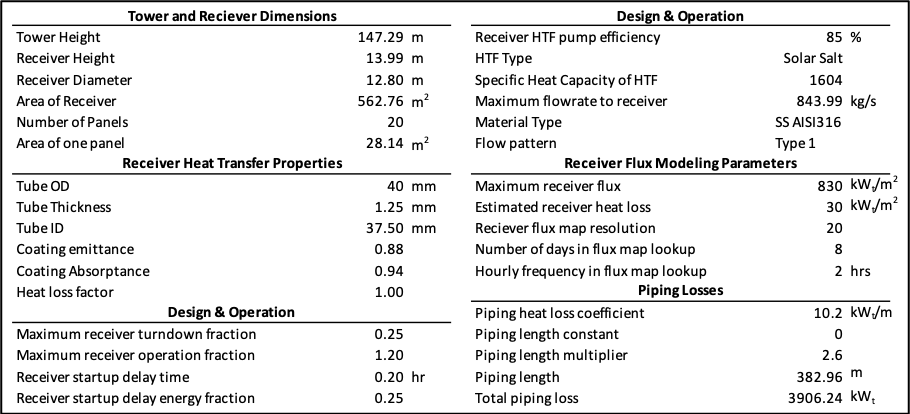
Fig. 15: Summary of Tower and Receiver data
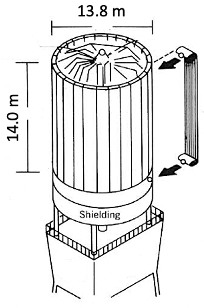
Fig. 16: Summary of Tower and Receiver data
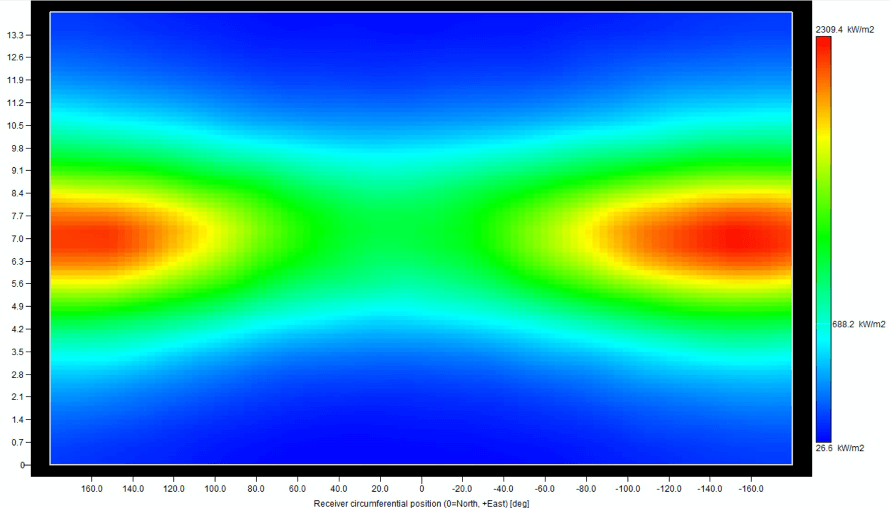
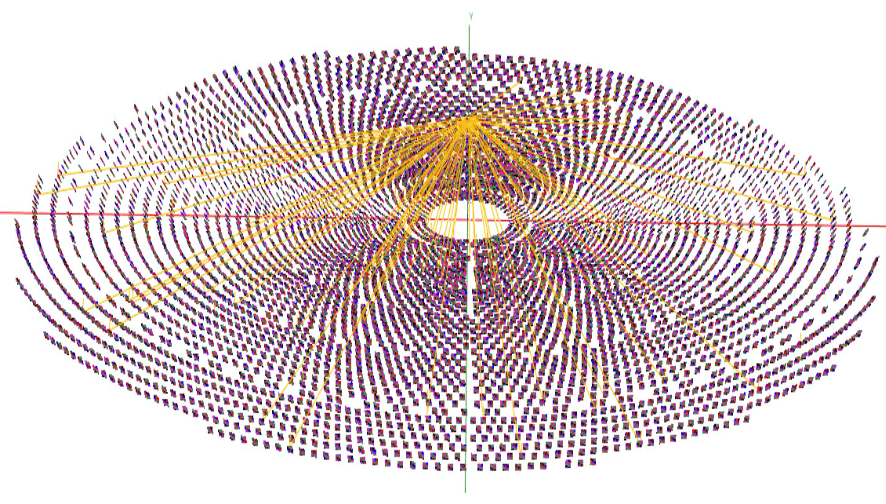
Fig. 18: Three-dimensional model using SolTRACE
Power Cycle
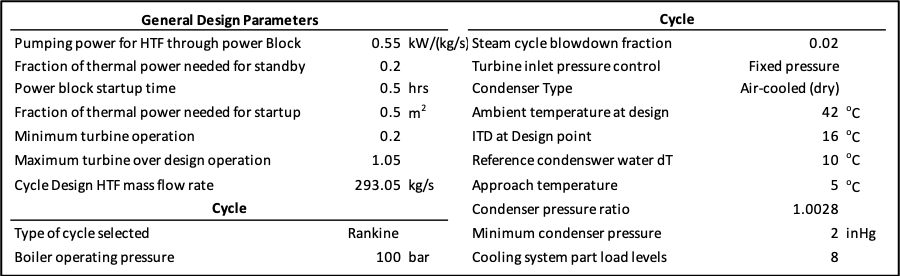
Fig. 19: Summary of Power Cycle
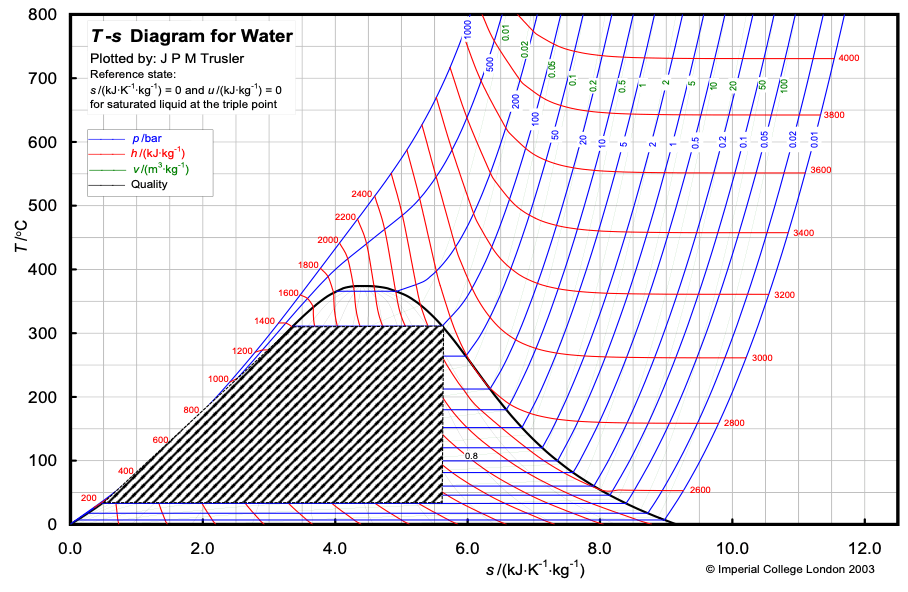
Fig. 20: Rankine cycle – CSP Power cycle with operating parameters
The main components within the system are the boiler/evaporator, turbine, condenser, cooling tower. The hot solar salt is pumped from the receiver to the ground into a power generation (steam-based: Rankine). Feedwater is compressed to 100 bar and fed to a boiler where it is heated using the hot solar salt. The steam is lead through a series of turbines and expanded to a lower pressure. This, in turn, drives the generator. The low-pressure steam is condensed fully with the help of a cooling tower (air-cooled) and reused for the same cycle. A certain portion of the steam is bled from the turbines and used to preheat water before it enters the boiler through the use of heat exchangers. In order to avoid an accumulation of impurities with the system, a certain amount of the stream is purged (blowdown) hence maintaining water quality
Thermal Storage
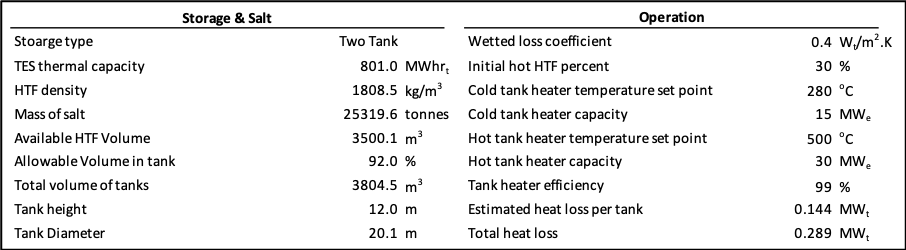
Fig. 21: Summary of Thermal Storage
Thermal energy storage is much more cost-effective than electrical storage; hence it is a viable option. Configurations for the storage can be made for different structures, i.e. shoulder, peaking or baseload. The system is placed along alongside the power cycle and sized for 6 hours worth of additional storage. Storage is added for three main reasons.
- Capture smaller bursts of energy from the sun that are too low for turbines to operate.
- Reduces the need for dumping excess energy when capacity is exceeded.
- To match the grid load profile and not put excessive strain on grid as renewables (intermittent resource) become more prominent in the future.
RESULTS
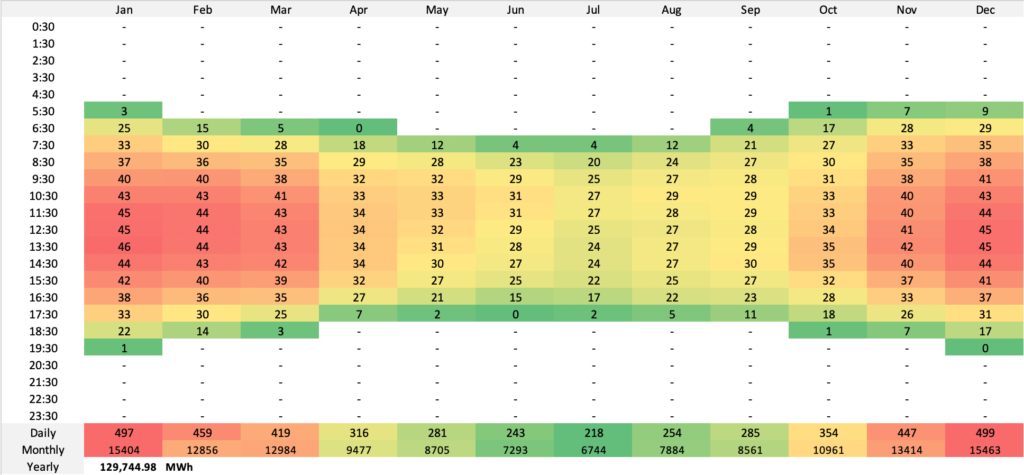
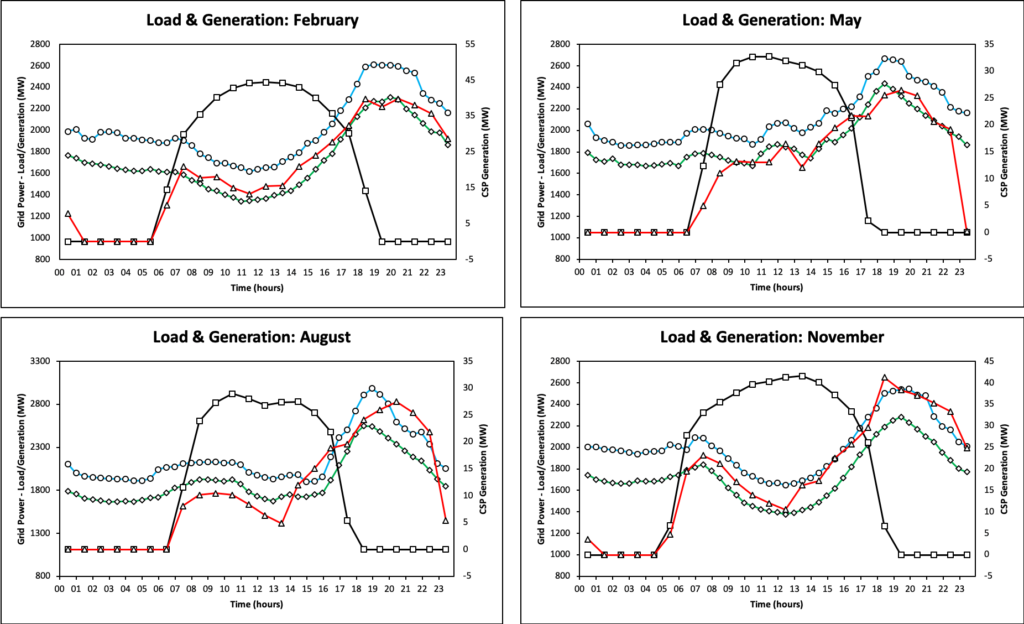
The outputs from SolarPILOT, System Advisor Model and SolTRACE bore the outputs which are summarised within tables. Taking these outputs, the hourly generation values for all months were found by scaling up the correlated DNI Data shown in Fig. 22. The sum of energy production from all the months yielded an output of approximately 130 GWh annually. Due to the addition of storage along with the Power Tower, optimisation is required to follow the grid profile. The generation profile is shown in Fig. 23 for February, May, August and November with the red and black line representing the optimised generation with and without storage respectively. The optimisation has been done manually using excel based on an additional 6 hours of extra storage time for each unit of energy generated.
ECONOMIC ANALYSIS
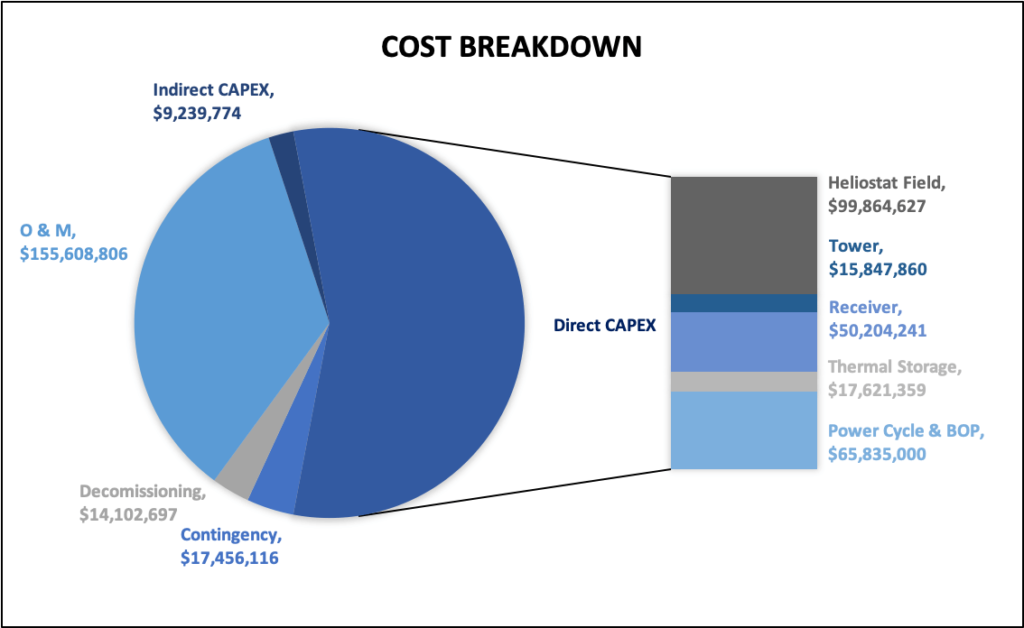
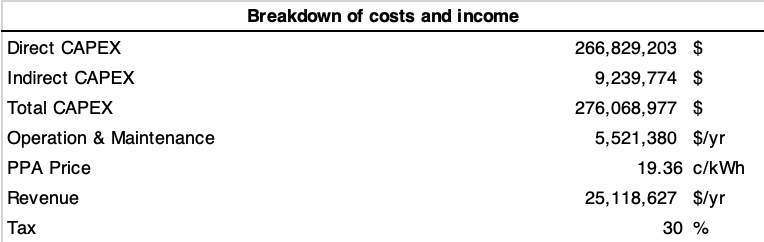
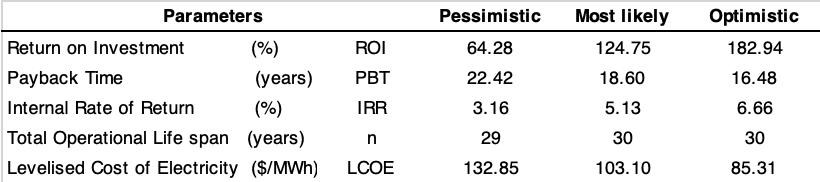
Fig. 26: Summary of costs and economic parameters
A cash flow is drawn by combining the various costs discussed along with the revenues associated for each respective years. The first three years Is assosiated with the construction phase where the CAPEX is split in a 25:60:15 manner to reduce interest rates while financing hence a negative cash flow figure with no revenue. As the plant moves on to the operational phase i.e the next 30 years, the cash flow turns positive and so a tax of 30% is applied by the Australian Taxation Office (ATO). Finally, at the end of the lifespan of the plant, all of the equipment has to be dissassembeled and removed from site over the last year of the plant.
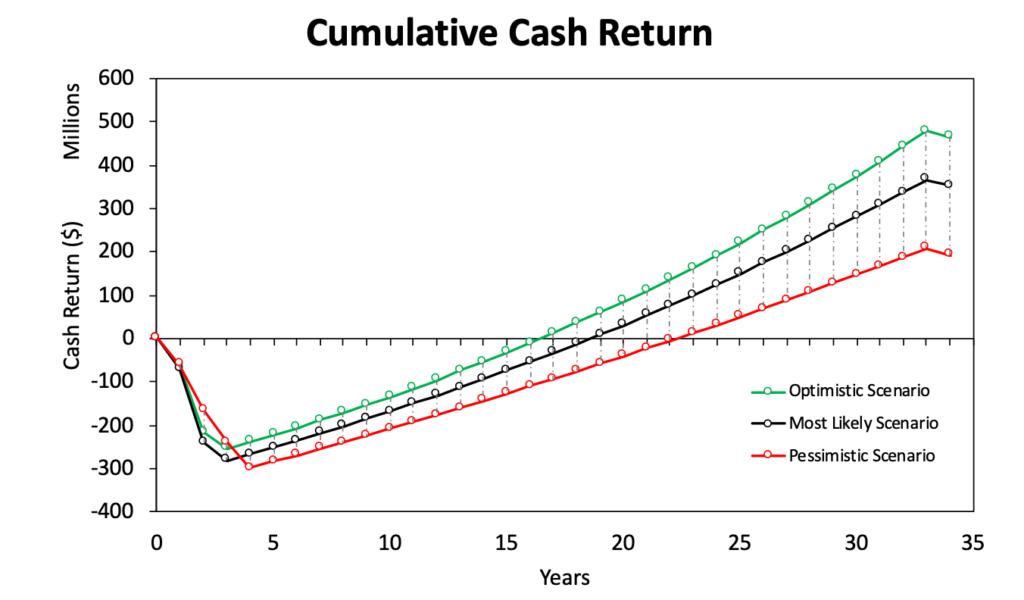
Fig. 27: Cumulative Cash Return graph
ENVIRONMENTAL SCOPING
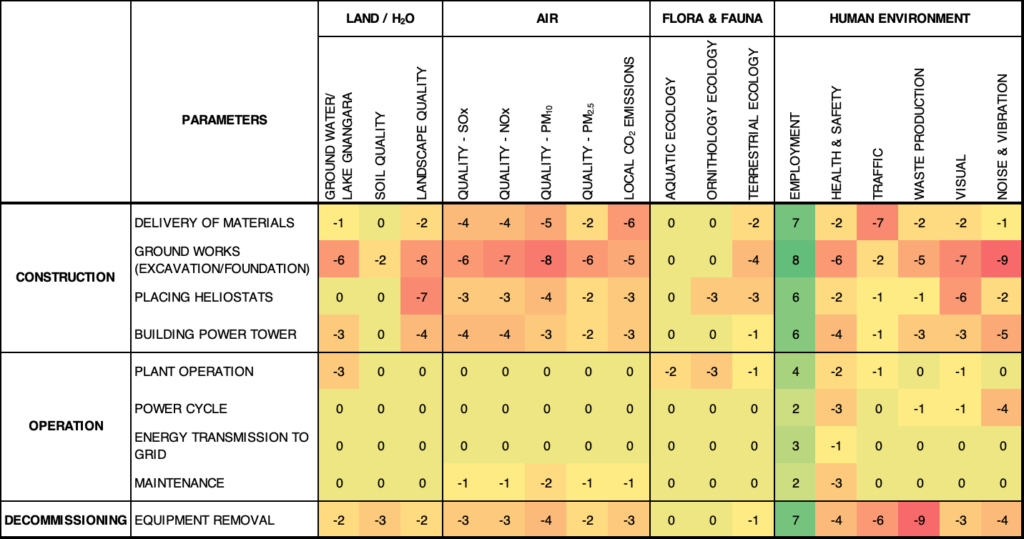
Fig. 28: Scoping Matrix
Construction & Decommissioning Phase
Most of the environmental impacts occurs during the construction phase & decommissioning phase the former that spans for a total of three years. A major issue is airpollution caused due to diesel engines for HGV’s coupled with traffic due to delivery of construction material and equipment. This can be avoided by transporting goods before peak traffic hours and using better fuel. The salt in particular leaves a huge environmental footprint as they are mined and imported from Chile. Most of the materials used (steel, concrete, glass etc) can be recycled. Finally, the impacts on flora and fauna can be associated with the construction of access roads and building works. The decommissioning phase involves dismantelling used equipment as demolishing the power tower which are either recycled or landfilled. The scoping matrix is with relevant scores are reflected above.
Operation Phase
Water used to provide electricity through thermodynamic cycle, although most of this water is returned back to the environment (Lake Gnangara) might possibly be different to the input point. Hence filtration units as well as cooling towers might be necessary. The maintenance operation like broken or rusted metal, machine parts, oily rags etc. There are a bunch of hazardous wastes such as solvents, Heat Transfer Fluid such as NaNO3, KNO3, waste oil etc. which are usually stored and disposed as per legal requirements.. The usage of water without careful consideration could also result in the destruction of marine habitat within the Lake. Another rare possible impact is the collision of birds with the solar tower or the heliostats. This can be mitigated by carefully choosing a location not close to migratory paths.