BIOMASS FACILITY
ENVIRONMENTAL IMPACT ASSESSMENT
BIO POWERED
LOCATION
Project Description
The Longridge Road Energy Centre (LREC) is a proposed 42 MWe, privately funded project worth £200 million by Green Energy Miller Turner Ltd, a subsidiary of the parent company, Sterling Energy Holdings BV. The exported energy is generated by processing approximately 395,000 tonnes of non-hazardous residual waste with a capacity to power 109,000 homes annually. The purpose of this project is to deliver clean energy through a cyclical economy rather than landfilling or exporting.
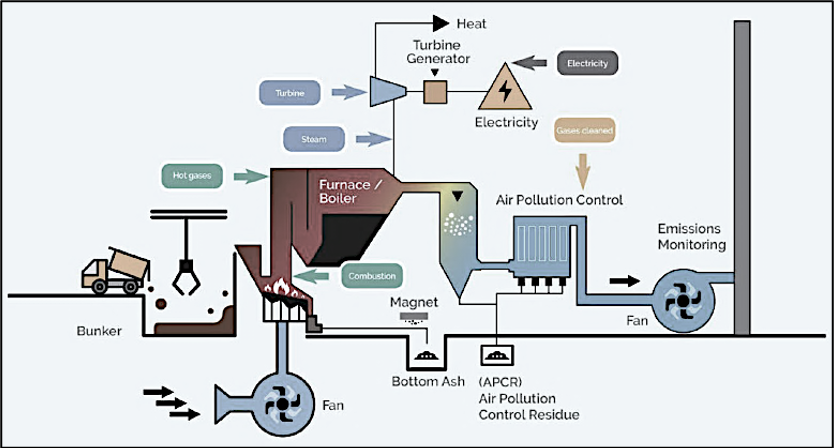

- Residual waste is transported and dried on a grate
- The dried waste is sent for combustion in the furnace.
- Excess air is introduced by the use of fans for complete combustion.
- The products of the combustion reaction are gases (CO2, H2Ovap) and trace elements.
- These hot gases are used to boil water to generate steam.
- The Generated steam is used to drive the turbine generator to produce electricity
- Electricity is either sold to customers via the grid or direct connections.
Environment Description
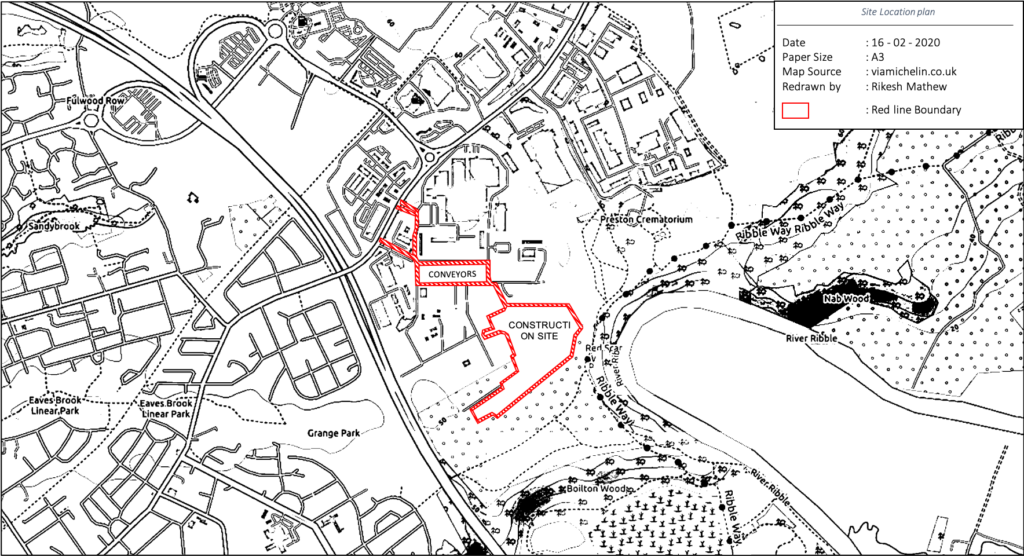
Residential properties and River Ribble located approximately 500 m (SW) & 170 m (E) respectively to the site. Woodlands occupies the land between the site and the river Ribble. Surrounding the estate, there is one school in a 1 km radius of the site and twenty-two schools on a 3 km radius. Additionally, there are four parks and five care homes within the 3 km radius, as shown in figure 3. These locations are sensitive due to the age group of the population, which is either young kids or old adults. The soil is classified as slowly permeable, seasonally wet, slightly acid but base-rich loamy and clayey soils with low carbon content. The elevation for the site is roughly 50 m AoD. However, the project location is currently situated in an industrial zone area with other industries close by.

SCREENING
SCOPING
Stakeholders

Project Stages
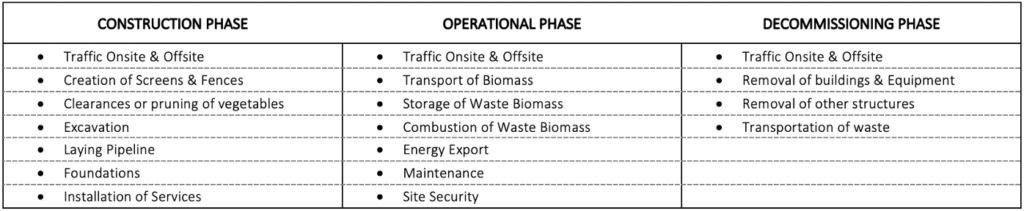
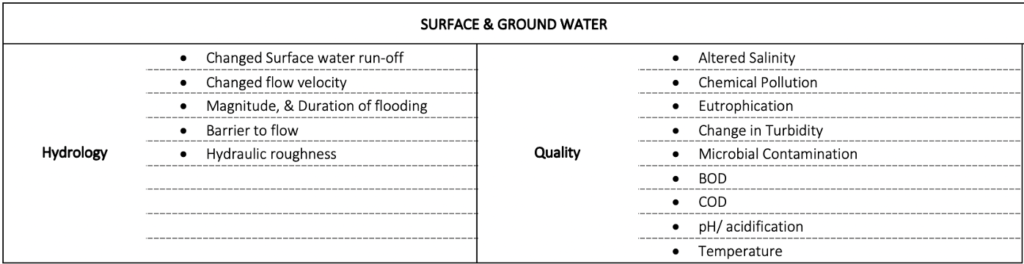
Environmental Impacts


Scoping Matrix
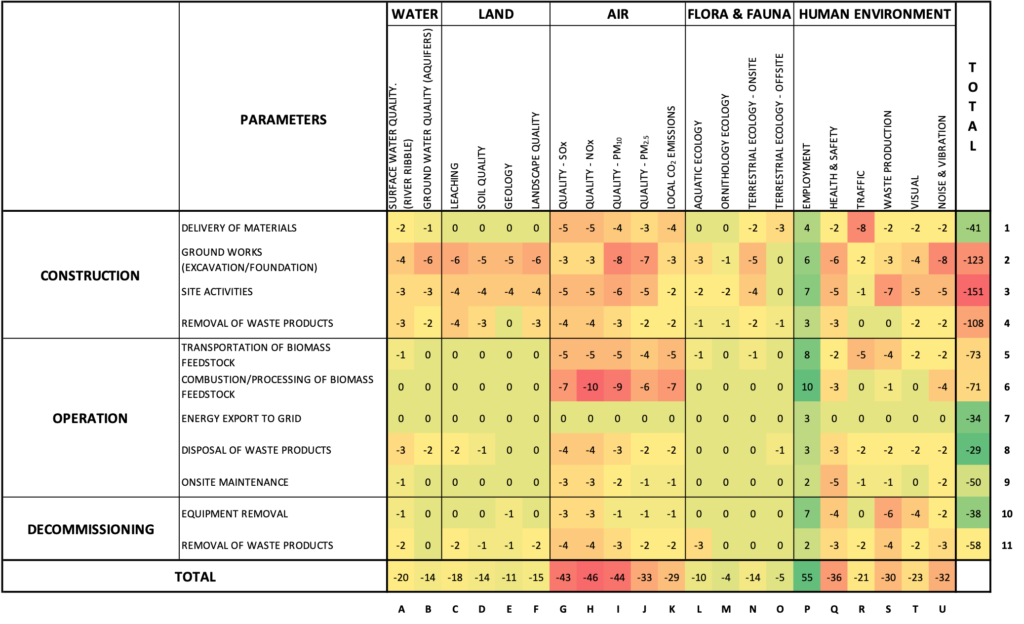
Significant Factors
Air Quality – NO2 (Cell H6)
Nitrogen Dioxide (NO2) is one of the many gases listed within the AAD as it is a by-product of combustion of fuels, i.e. non-hazardous residual waste. The health effects from the inhalation can be varied depending on the concentration and duration of exposure. Short period exposure can exacerbate respiratory diseases such as wheezing, coughing and asthma. Longer exposures could lead to asthma development and respiratory infections. This compound is also known to combine with other chemicals which causes acid rain and could potentially result in damaging sensitive ecosystems. Particles of nitrates also have the characteristic to make air hazy and reduce visibility. Additionally, it has been found that oxides of nitrogen have links with eutrophication. Furthermore, with the city being deemed as an Air Quality management area (AQM) due to excessive Nitrogen Dioxide concentrations, this parameter is seen to have a higher score than others.
Air Quality – PM10 (Cell I6)
During the operation phase of the biomass plant, small particles with a diameter less than or equal to 10 m for PM10respectively enter the lungs and get deposited deteriorating health. The emissions of particulate matter are also significant in the operation phase, where the combustion of waste biomass. This is highly dependent on the properties of Biomass, excess air, temperature etc. A high temperature is seen to shows a decrease in PM10 levels but an increase in submicron particles due to mineral vaporisation. Complete combustion with the presence of excess air also reduces soot formation. Most of these issues can be mitigated by the use of wind shielding, washing, abatement technology etc.
Air Quality – PM10 (Cell I2)
The Construction involves civil works such as site preparation, excavation and PCC, earthworks, laying the foundation where dust (PM10) is generated. The stages that are the most damaging involve earthmoving using scrapers where transport distances of 450m can produce ten times more particulate matter than just loading or unloading operations by scraper units. The next significant activity is truck loading activities when compared to truck dumping, which reveals a particulate matter value 100 times higher than the latter due to the low capacity of the loaders. Lastly, the carryout due to mud and dirt due to transport in the active construction zone.
Human Environment – Traffic (Cell R1)
During the construction phase, there will be movement of HGV and light vehicles to and from the site to deliver material goods as well as the construction crew. When analysing the civil works time frame, it can be estimated that peak traffic can be expected at the end of year one and till year 2. The timing for construction and site is most likely to occur from 8 am to 6 pm on weekends, and 8 am to 1 pm on weekends with no work permitted on bank holidays and Sundays. This can be mitigated by sharing car or bus rides to reduce the flow of traffic to the site and by pulling in construction site vehicles before peak traffic time using historical data.
Human Environment – Noise & Vibration (Cell U2)
The construction phase includes activities for groundworks such as excavation, laying foundations etc; all of which that requires heavy machinery and vehicles. It is common to see sound levels exceeding 90 dB(a) and vibrations that accompany the work. This is most harmful to the site workers and individuals located nearby the site who have to endure this annoyance. The site workers can be expected to wear appropriate headgear to suppress excessive noise. The timing of the construction can also be phased in a way so as to incorporate it into the busiest durations of the day and to avoid odd hours.
Chosen Enviro Factor
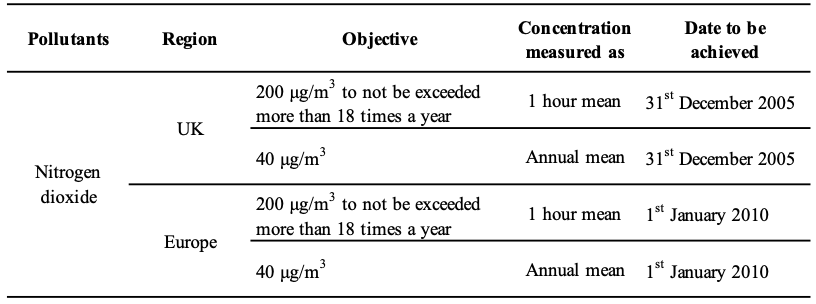
The European air quality legislation falls under Directive 2008/50/EC (Ambient Air Quality Directive) which went into effect by 11th June 2008. This consolidated the legislation prior, i.e. Ambient Air Directive (AAD) which dealt with pollutants such as Nitrogen Dioxide, Sulphur dioxide, Benzene, Lead, Carbon Monoxide and PM10, PM2.5 by providing appropriate value limits. The 2004/107/EC directive added other components – Aromatic HC’s, Cadmium, Mercury and Nickel. These directives were translated to UK Law through the Air Quality Standards Regulations 2010 along with amendments.
The operational phase is predicted to have the most substantial impact when looking at NO2 emissions not only because of the effect it has on human health but because of the duration that the occurrence happens i.e. 30 years. The development will require a continuous supply of waste fuel to the bunkers by the use of heavy goods vehicles (HGV’s) for the production of energy. The waste fuel is then mixed by the use of grab cranes to achieve consistency. The actual combustion process uses the fuel and (oxygen supplied in excess) to produce heat. The fuel used (i.e. non-hazardous residual waste) is not ‘clean’ as there are a lot of impurities that lie within it that either goes through complete or incomplete combustion to produce Nitrogen dioxide or other oxides of nitrogen. Coupled with the fact that the city is an Air quality Management Zone due to past events that lead to concentrations exceeding the limits.
Baseline
A baseline analysis is undertaken to understand the original status of the environment[36] before any work is undertaken and the estimate of concentration trends with the project not being constructed. This baseline is compared to the changes that will occur when the project is implemented. To determine the baseline, under the Environment Act (1995) in Section 82, by law, local authorities have to conduct air quality reviews within particular areas for key pollutants. Preston Borough Council has classified five regions[37] as Air Quality Management Areas (AQMA’s) all of which are a result of nitrogen dioxide concentrations. These regions lie within a 7 km range from the development site.
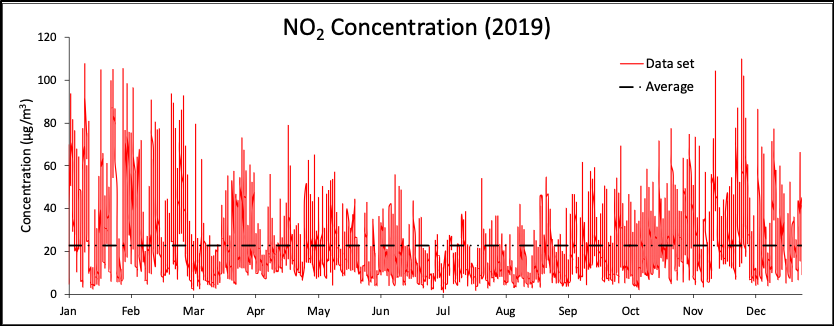
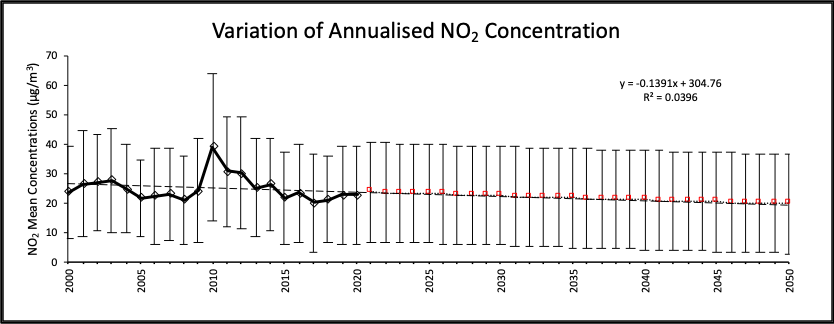
Figure above reveals a monthly variation of NO2 levels for a measurement centre in Preston near the project site with an average of 22.74 mg/m3 in 2019. It can also be noted that a projected value of 19.73 mg/m3 by the year 2050 (end of life for the biomass plant) using a linear trend. Although these values give a general estimate of NO2 levels, primary data might need to be obtained through the use of diffusion tube (coefficient of variation 20%) or chemiluminescence continuous analyser (coefficient of variation 15%) at site on an hourly basis. This data can be integrated into a MLRM model to obtain a more realistic baseline.
Impact Prediction
Analysing wind rose data is critical to evaluate immediate areas that will be affected as a result of the emissions. The Wind Rose on the left shows the probability of winds from Western side to the construction side is higher than the easterly side which reduces the impact on the majority of schools, care homes and parks are not impacted while observing the map. However, the other wind rose shows a greater variability on the eastern side winds which hits the more sensitive areas.
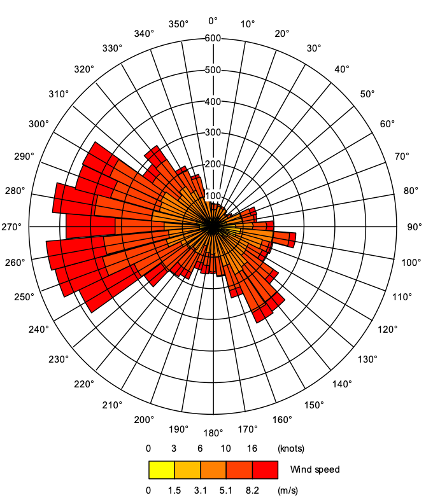
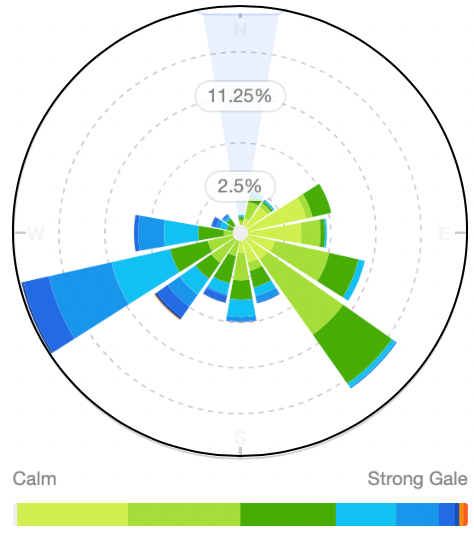
Another critical issue to be addressed is that although the wind rose sheds a positive light, five regions of Preston is deemed an Air Quality Management Area Region (AQM), and hence it does not matter as the emissions are dispersed to the surrounding regions. The location of the source of data for WR1 is 26 kms away from the project site and the data set is 3 years old, whereas the data for WR2 is a five-year average for a premise 3 kms away. Using either one adds uncertainty to the impact assessment if this data is used without manipulation. Ideally, primary data must be obtained which will highlight the actual wind speed and direction however if this is not a viable option due to the timeframe, a weighted average between the data sets shall be investigated as per the norm to obtain a single dataset that can be used.
Similarly, hourly meteorological variables are to be obtained as well. This includes Vapour Pressure, Dry Bulb temperature, Visibility, Base of lowest cloud, Boundary layer depth, radiation, stability indices, historical NO2 data, predicted NO2 emissions from biomass centre etc. Furthermore, other parameters including stack height, building position, terrain, surface roughness are considered within the model to obtain a sensitivity analysis to provide a range of minimum and maximum values for NO2concentrations.
Air quality modelling for future NO2 concentrations is simulated through the use of dispersion models i.e. Pollution Climate Mapping (PCM model) as suggested by the Department for Environment, Food and Rural Affairs (DEFRA) National Compliance model. However, these models have a degree of uncertainty and are employed when all meteorological variables are not available. These models are used for a range of purposes; however, there are background calculations that run. This section dwells into depth for nitrogen
Multiple Linear Regression Method
MLRM[44] is used to simulate and generate a quantitative relationship between NO2 concentration data, meteorological parameters as described earlier and future trends of NO2 concentration. Meteorological parameters are given ratios to show the ones with the most considerable influence and their effective magnitude on prediction. Using SPSS software, backward stepwise regression can be executed to attain predictive equations for concentration. The equations are in the form
Artificial Neural Networks
Used as an alternative predictive method[45] used instead of statistical modelling. Several neurons or non-linear functions are held with parameters adjusted to data. The output (predicted NO2 concentration) and input data (observed NO2 concentration) is dependent on the factors put into the system
Constraints
These dispersion models are incomplete[46], and methods implemented to derive a more wholesome model leads to increasing uncertainties due to complexity. This leads to preferable omission when the performance of models is not improved substantially. However, complexity could also lead to a more acute forecast rather than using arbitrary parameters.
Another issue is the scaling and calibration within the modelling. Currently, there are no ways to obtain the aforementioned parameters while campaigning the site due to limitations. These parameters are usually obtained through extrapolation from similar sites.
Furthermore, the availability of accurate historical meteorological and emissions data is an issue. Usually, when more than one set of data is available, it is tested against the other to calibrate the model. Mapping emissions (NO2) from sources, i.e. construction activities or off-road machinery are difficult due to the activities being of transient nature.
Mitigation Methods
- Use filters and abatement technology to capture NO2 emissions more effectively
- Use Best Available Technology Not Entailing Excessive Cost (BATNEEC)
- Use a cleaner fuel or a fuel that is pre-treated to remove impurities
The first mitigation step should be employed in any biomass energy recovery facility whereas the second and the third mitigation methods are employed contingent on economic feasibility. Realistically, the third method would require a complete overhaul of the design and should be employed as a last resort only as it is not cost effective. An audit of the actual emission data must be collected post project construction to ensure that the guidelines were adhered to. This can be achieved by setting up independent air quality measurement
Final Decision Making

The Environmental Report (ER) is compiled with the NO2 emissions present in this report as well as other environmental parameters shown under the scoping matrix making an informed decision by the Lancashire City Council on whether or not the project receives a ‘go-ahead’ and the conditions contingent upon approval. Public shall be consulted along with statutory consultants, project developer, project owner and other associated stakeholders.