ECONOMIC EVALUATION OF ENERGY STORAGE OPTIONS FOR AFTON WINDFARM
WIND POWERED
LOCATION
ABSTRACT
This paper details the study to maximise retained earnings and grid trading optimisation of Afton Windfarm, East Ayrshire, Scotland upon retrofitting energy storage solutions. Prominent storage devices in the current marketplace were examined including Pumped hydro, Vanadium Redox, Li-Ion, Lead Acid, Zinc Bromine, Sodium Sulphur, Flywheel, Supercapacitors and Superconducting magnet. A trading model was developed based on wind data and spot market prices where round-trip efficiency is a key factor. Trades were analysed to generate additional revenue. An economic model that evaluates popular key performance indicators include Cumulative Cash Return, Return on Investment, Payback time, Net Present Value, Internal Rate of Return along with a host of supplementary parameters for each configuration. The final selection of energy storage options – Lithium Ion and Pumped Hydro – vested with inherent risk tolerances and consolidated revenues over its effective life was reported undoubtedly as best investment choices – both addressing investor gains for the shorter and longer term periods.
INTRODUCTION
Energy Mix and Climate Targets
Statistics from year 2019 exhibited a 90% renewable output w.r.t gross electricity consumption; a growth of 18.4% from the previous year[1]. This rapid growth is in tandem with the vision set by government of Scotland for 2030 and 2050; where Vision 2030[2-4] is set to realise 50% of all the energy generated from renewables and Vision 2050[2, 5, 6] gaining traction to achieve almost complete decarbonisation (80% cut in emissions) of all sectors alongside flexible generation and demand management. Currently, onshore wind represents an overwhelming majority of 70% [7] followed by hydro power and offshore wind. An additional capacity[1] of 7.1 GW is in the pipe- line awaiting construction for wind energy. Hence, the study of windfarms, is of vital importance, especially the one’s based onshore.
Afton Windfarm
Afton Windfarm (See Fig. 1) – East Ayrshire, Scotland[8] located next to Afton Reservoir (55.312591, – 4.151900) situated near Cannock and Craigbraneoch hills is the basis of this project title study . The relatively new onshore windfarm[9] consists of 25 Wind turbines, each with a rated power of 2 MW and a total rated power of 50 MW thereby categorised as a medium-scale farm. Red Rock Power Ltd., which is a growing sustainable developer in the renewable space, owns the windfarm currently through its acquisition[10] from InfraRed Capital in 2018.
Although not all of the windfarms are geographically similar with a reservoir nearby (Afton reservoir in this case), it serves as an ideal model for evaluating multiple storage solutions including pumped hydro for similar onshore windfarms.

Services of Energy Storage
Wind energy inherently is variable by nature. The addition of energy storage to Afton Windfarm is critical to improve the flexibility of the system to compensate for the intermittency of wind[11], thereby allowing for quick and accurate response. An estimated savings[12] of £8 billion per year is forecasted by 2030 with energy storage devices; as electricity market restructures. This aids optimisation of the infrastructure dealing with current generation & transmission, as it prevents costly upgrades.
Vast proponents of demand-side management propose the use of smart meters, which although imperative for peak clipping[13], valley filling and load shifting[14] cannot match peak demand without compromising after work leisure time. Hence this study is undertaken to reinforce supply-side management through the use of storage devices for windfarms to match demand profiles for the grid. The Department for Business, Energy and Industrial Strategy (BEIS – UK) has instigated action to provide incentives for grid management through energy storage. Some of these include[15] peak charge avoidance, frequency regulation[16], renewable capacity firming[17], distribution grid support, capacity markets[18] and these policies or regulations should be studied further to enhance viability[19] of energy storage use in Wind farm projects, which in general is not a construction practice currently.
Furthermore, energy storage options minimise irregularities due to frequency fluctuations[16] that prevents penetration of an amalgamation of renewable sources into the grid network. Energy storage options therefore enhances reliability and power quality, thus aiding the transition to a greener future. Energy security, a pillar of the energy trilemma [20] can be achieved only with the deployment of energy storage solutions, which will be crucial for Scotland in line with the outset visions envisaged and to lead globally while providing a see-saw guaranteed incentive to investors upon adopted contractual based term periods.
MODEL DEVELOPMENT
Certain data need to be acquired as pre-requisites for the trading model; this includes grid data, spot prices and electricity generation. Analysis of these pre-requisites provide statistical parameters such as minimum, maxi- mum, average and standard deviation and most importantly, customer centric lifestyle consumption trends that are crucial.
Grid Data
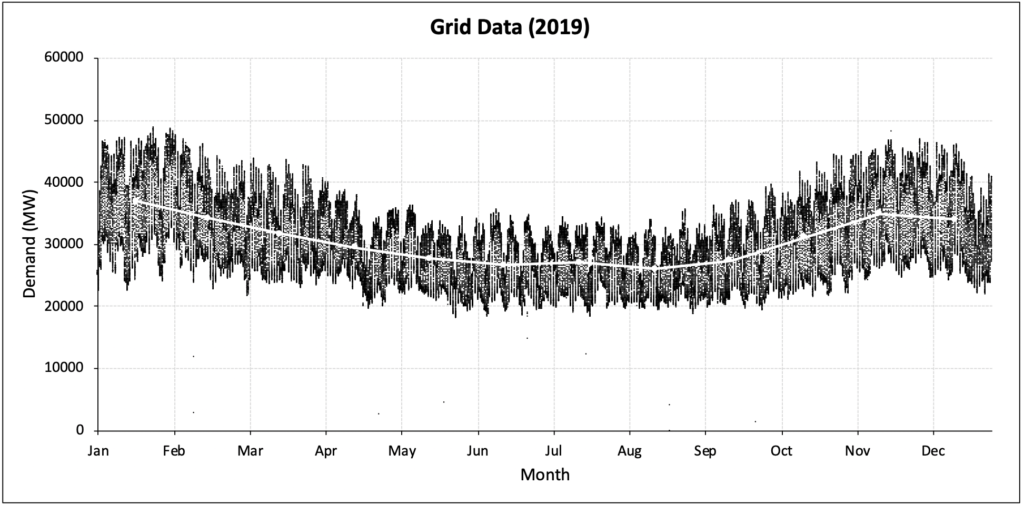
Fig. 2: Grid Data for U.K from Gridwatch Templar: Resolution of five minutes along with monthly average
A significant obstacle that remains for implementation is the high capital cost and the mindset that goes with it between Transmission System Operator (TSO)[21] and developers, where the former views storage as part of the energy plant and the latter as part of grid infrastructure. With the introduction to half-hourly energy prices, the gap between low and high wholesale prices widens with increased penetration of renewables & potential opportunities for financial gain increases. Currently, most investors within the UK energy storage field look at revenue opportunities within the capacity markets and frequency response. Other opportunities that exist include tendering for capacity as a way to balance local markets by the Distribution Network Operators (DNO)[22]. Heavy reliance on revenue streams such as Enhanced[23] or Mandatory Frequency Response[24] along with short term contracts is deemed unreliable to some risk-averse investors. In contrast, some investors still find the potential within this niche balancing markets. When evaluating the data printed in Table 1, through analysis of grid data (See Fig. 2), there is a general trend of higher demand & variation during Winter and lower demand & variation during summer times partly due to the use of electric heating appliances.
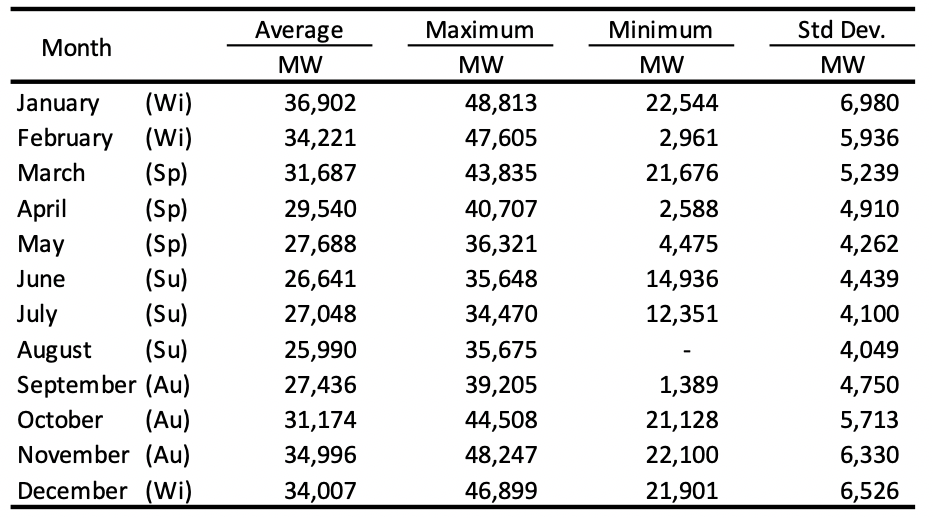
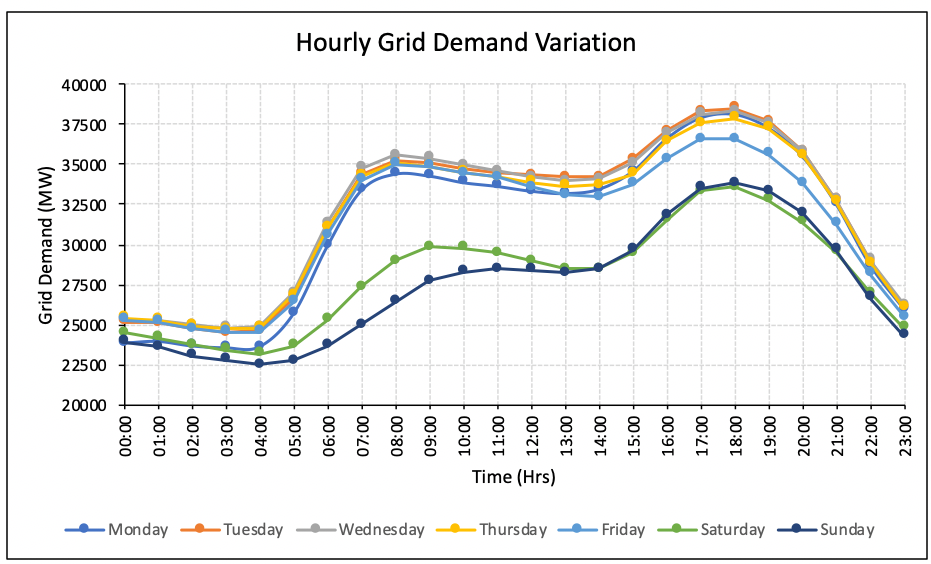
Table 1: Monthly Average, Maximum, minimum and standard deviation for Grid data (ABRV: Wi – Winter, Sp – Spring, Su – Summer, Au – Autumn)
Fig. 3: Grid demand as a function of hours for the various days of the week
The data analysis of the ’hourly demand distribution for week days’ (See Fig. 3) reveal a distinct trend in grid power showing higher and lower demand variations for the UK’s work-week and weekends respectively. The data displayed a low average demand during night hours (23:00 to 04:00) when most people are asleep, with a succinctly rapid ramp-up during early morning hours (04:00 to 08:00) as people get ready for work followed by a plateau between 08:00 to 14:00 hours.There is a higher secondary peak at 18:00 hours when most people return home from work or school, leading to an increased usage of electrical appliances. Gradually, demand falls as people retire to sleep. The weekends show a more gradual pace of demand ramp up with a lower secondary peak during the evening.
Spot Market Prices

Fig. 4: N2X Day ahead prices hourly and daily average for the years 2013 to 2019
System Sell Price (SSP) and System Buy Price (SBP) are obtained by settlement period at half-hourly intervals, which are calculated by the National grid system operator based on the cost incurred to balance the grid. Majority of wholesale trading prices are agreed upon in private between sellers and buyers. However short-term trading of energy with published price data is available within EPEX SPOT[25] and Nord Pool Group[26] with day-ahead market prices for hourly data sets.
The figure (see Fig. 4) shows large volatility within day-ahead prices for intra-day, daily prices for the months of autumn, winter and start of spring. The case of high degree of volatility could be attributed to the use of electric heaters and this can be verified through an hourly analysis. The average prices for the months between April and September are relatively stable with a low degree of volatility. The weighted average of historical data is used to ensure the viability of spot market prices. Data from previous years (2013 to 2019) were averaged on a weighted basis where recent years have a higher weightage than former years. The assigned weight for year 2013 starts with a value of 1 and subsequent years with an increment of one each.
The yearly average prices for the intra-day markets (See Table 2) shows a low Coefficient of Determination (R2) of 0.03, but it can be observed that the standard deviation increases steadily through the years. This could be explained by the growing penetration of renewables into the energy markets with the resultant increase in the volatility of prices[27].
The monthly prices plotted (See Fig. 5) employs the weighted average technique that provides a sharper output as you zoom into the y-axis. The hourly average prices (See Fig. 6) follow a dis-tinct trend in the weekdays with three troughs found at 04:30, 15:30 and 22:30 with peaks found between these data sets while the weekends show a slight lag. This is promising indication for revenue generation using retrofit storage options where the energy that is produced during trough periods can be held and later exported to the grid at peak price intervals. The peaks are almost equally spaced out, which positively hint to decisively construct an energy storage device that is sized appropriately.

Table 2: Monthly Average, Maximum, Minimum and Standard deviation for historical data
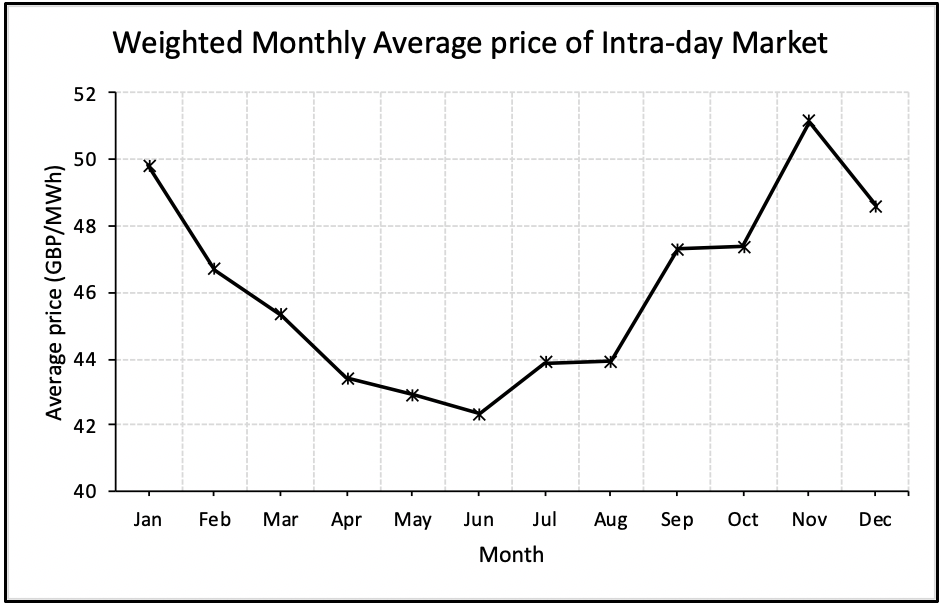
Fig. 5: Average Monthly prices for historical data (Y 2013 – Y 2019)
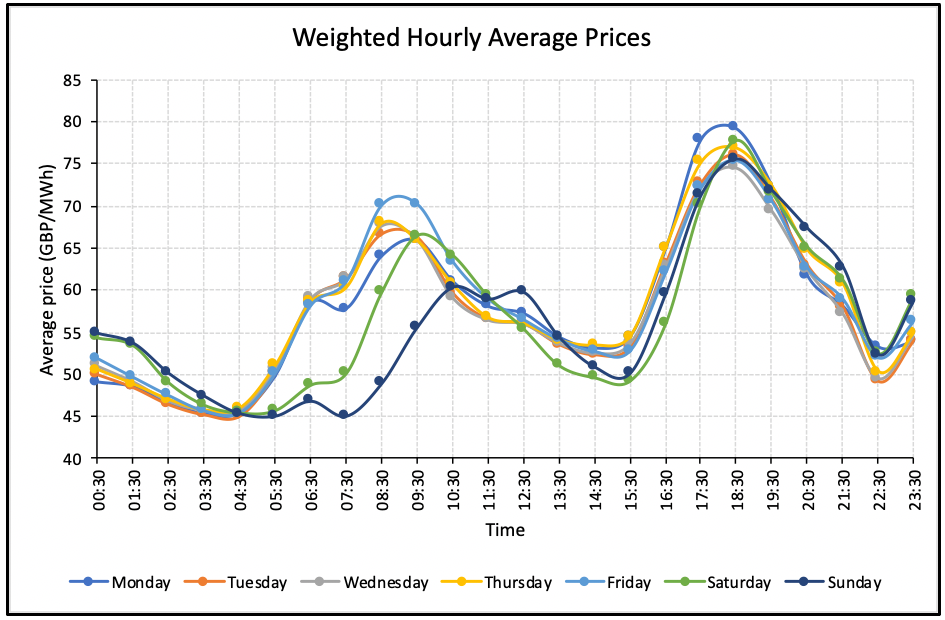
Fig. 6: Weighted hourly average Intra-day market prices (Y 2018)
Electricity Generation

(1)

(2)

(3)

(4)

(5)

(6)

Fig. 6: Weighted hourly average Intra-day market prices (Y 2018)
Fig. 6: Weighted hourly average Intra-day market prices (Y 2018)

Fig. 6: Weighted hourly average Intra-day market prices (Y 2018)
REVENUE STREAMS
Current Outlets
Income statement (2018) of Afton Wind Farm Lmtd, reported a revenue of £7.3 million [33]. A rough revenue estimate of £53.61/MWh is expected on average (post-correction when electricity generation initialised, i.e. February), using the known total calculated energy generated per annum (147 GWh). However, we find this is below the average wholesale market prices, which at 2018 stood at £57.39/MWh.
The financial statement also declares the use of Renewable Obligation Certificates (ROC)[34] as a source of revenue which is incorporated within the average prices. When analysing ROCs[35] for Scotland, an average of 1.07 ROCs issued per MWh of renewable energy due to a higher capacity as compared to England with 1.34 ROCs/MWh. The average price was estimated at around £55.04/ROC, which translates to £58.9/MWh, which is slightly higher than the revenue estimated from the average wholesale market price. There lies an existential portion of revenue stream, which was lost due to lack of storage conjunct with electricity dispatched during time periods when prices were low.
Potential Outlets
Other potential venues for revenue generation lies with Frequency Response (FR) [23, 24] which ranges from high, primary and secondary services where the National Grid ESO provides incentives depending on the response time and duration. Due to the low volumes of enhanced FR contracts rolled out – it was not included in the analysis. The other services were analysed on a quartile basis and the median results are shown in Table 3.
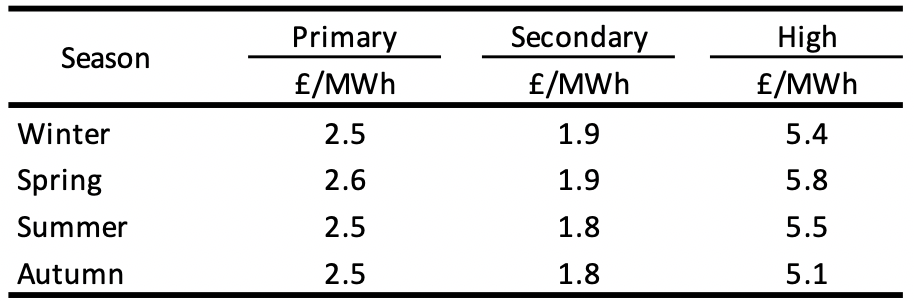
Table 3: Frequency Response service incentive scheme