FORECASTING CANADIAN COMPLETIONS: A SYNERGY OF TRADITIONAL & MACHINE LEARNING RANDOM FOREST
PYTHON POWERED
LOCATION
ABSTRACT
Canada’s residential market experiences a chronic supply deficit, making affordability worse and limiting entry for young families and immigrants. National housing completions over the next 12 quarters (2023 Q1-2025 Q4) are projected in this study from quarterly data on the Canada Mortgage and Housing Corporation from 1948 Q1-2022 Q4. Three models i.e. Exponential Smoothing (ETS), Seasonal Autoregressive Integrated Moving Average (SARIMA), and Random Forest (RF), are contrasted. The models were trained on 1948 Q1-2007 Q4 and tested on 2008 Q1-2022 Q4 based on RMSE, Theil’s U2, and AIC. RF provided the most accurate results (RMSE = 2,648; U2 = 0.301), which were superior to those from SARIMA (RMSE = 4,460) and ETS (RMSE = 4,555), especially during turbulent times like the Global Financial Crisis and COVID-19. RF’s strength lies in revealing non-linear, state-based relationships from lagged inputs; SARIMA and ETS, while interpretable, proved sensitive to structural changes. Forecasts show completions will be roughly 55,360 units by 2025 Q4, short of filling the national supply gap. Confidence intervals were calculated from RMSE-based approximations for RF and from state-space intervals for ETS/SARIMA. The results show RF’s complementarity for short-horizon planning and ETS/SARIMA’s strengths for transparent seasonal decomposition. The findings can be used by policymakers, industry captains, and investors when developing strategies for ramping up supply and bringing Canada out of its affordability crisis..
INTRODUCTION
Canada is currently experiencing a critical supply gap in its housing market, deepening affordability concerns and limiting access to homeownership for young families and immigrants, which was chosen as a topic because its connection to current national forums on economic policy and urban planning issues in Canada is direct. Forecasting housing completions is significant because it can be used to guide government intervention, inform investment strategy, and reduce the population and migration pressure-related risks, ending up supporting better-balanced and more equitable housing markets (Farhan, 2024). More recent work emphasizes that through increased residential construction, supply has failed to keep up or meet demand, and prices and vacancy rates have continued to increase, and major centers’ demand continue to be critically undersupplied (CMHC, 2025).
For example, forecasts show that even though 2025 housing completions might be impacted economic uncertainty such as trade tariffs from USA, total supply growth will still go on, though not at a high enough rate to resolve affordability crises outright (CREA, 2025). In addition, upcoming trends highlight the requirement for imaginative policies to increase productivity across homebuilding, such as decreasing regulation hurdles and upscaling sustainability steps to respond to resilience against the climate (PwC Canada, 2025). Through the analysis of past quarterly data provided by the CMHC and making use of conventional forecasting such as ETS, SARIMA, and sophisticated Machine Learning method i.e. Random Forest, this work seeks to provide accurate predictions capable of facilitating strategic planning within the homebuilding industry
Research Questions
The primary objective of this study is to forecast housing completions in Canada using data from the Canada Mortgage and Housing Corporation (CMHC, 2025), which ranges from Q1 1948 to Q4 2022. Three methods i.e.ETS, SARIMA, and Random Forest are used and evaluated to provide deep insights.
Question 1
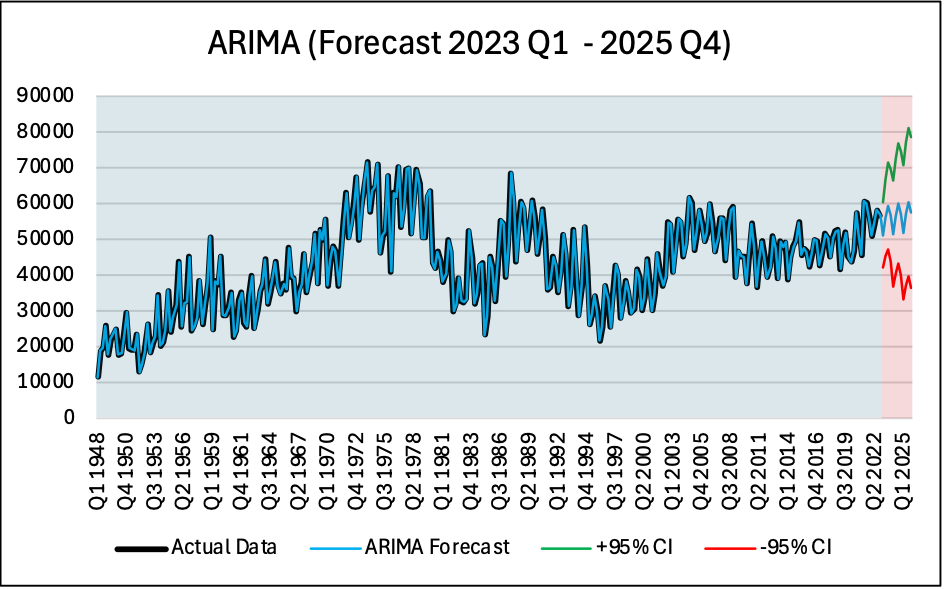
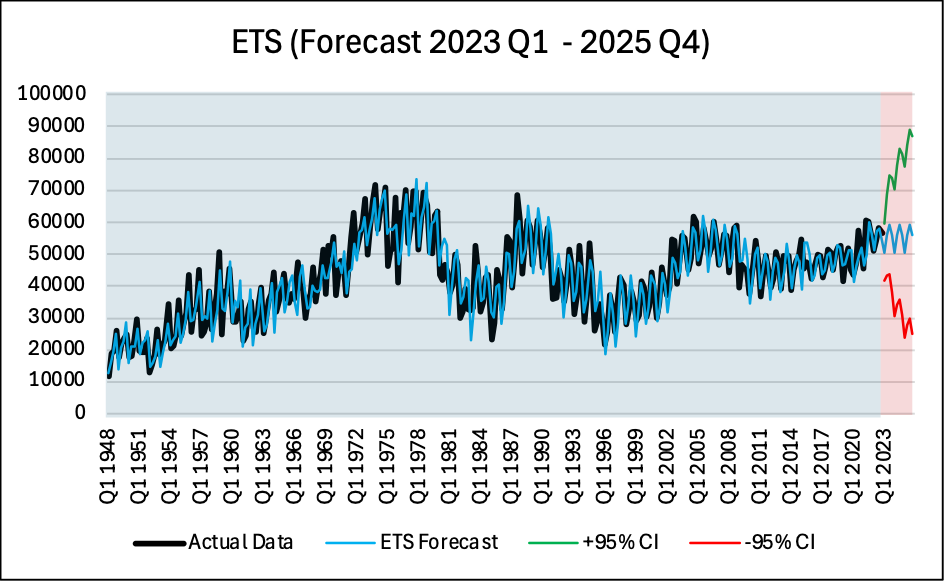
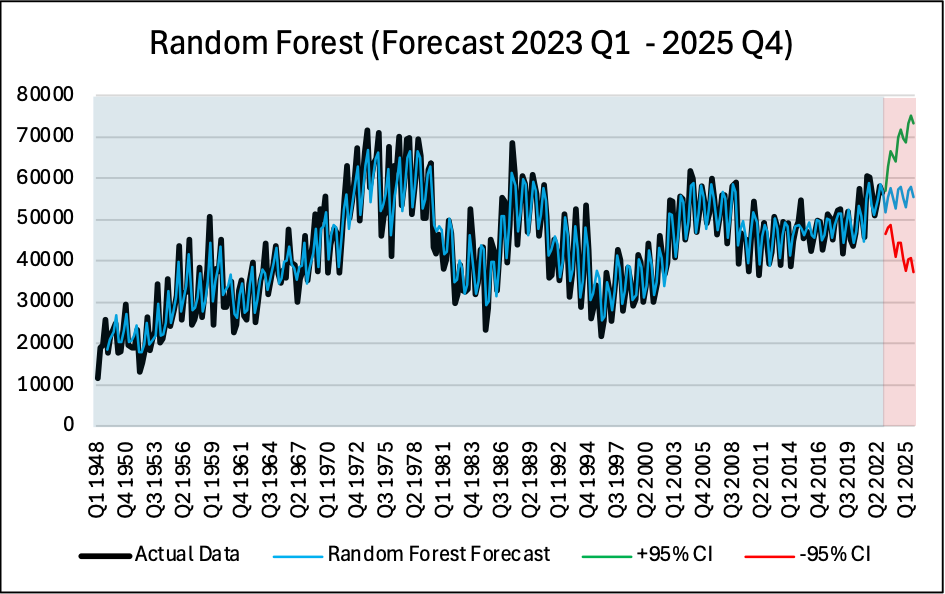
What are the forecasted housing completions in Canada for the next 12 quarters (Q1 2023 to Q4 2025)?
Question 2
How do the ETS, SARIMA, and Random Forest methods compare in terms of forecasting accuracy and handling seasonality and trends in the CMHC housing completions data?
SARIMA
ETS
RANDOM FOREST
LITERATURE REVIEW
Canadian forecasting for the housing market now begins to employ machine learning (ML) and time series approaches to observe supply deficit worries and affordability for the typical Canadian. But the primary emphasis on most these papers is on prices for houses and not aggregate quantities for houses completed. For instance, Zhan et al. (2023) presented a support vector machine-based hybrid machine learning framework, which integrates support vector machines and other schemes to predict prices for houses. The procedure is additionally accurate than the customary procedures because such ML approaches recognize non-linear patterns between the data as well. Applied together with global data, the method is also exceptionally proficient in capturing economic shocks but, it lacked the seasonal quarterly patterns particular to completions within the Canadian housing sector, which shall here be accounted for by virtue of seasonal patterns too
When Yang et al. (2023) researched Canadian markets, they attempted to incorporate support vector regression and contrasted it with common linear models attempt to better predict monthly appreciate prices on houses and appreciate sales on houses. They determined a gain in accuracy but it was not significant statistically. The study also revealed certain machine learning limitations on typical time-series data that doesn’t include seasonal adjustments because one such report utilizes those such as SARIMA and ETS. Further, this paper completely omitted completions, which are very essential for Canadian policy for supply shortages.
Similarly, Mohamed (2023) proposed a new deep learning model for real estate housing price prediction that surpassed benchmarks in trend-capture performance but is strongly reliant upon neural networks with no explicit comparison to established methods like SARIMA or ETS. The model’s capability to handle non-linearity is remarkable, but it was generalized and not Canada-specific, and it did not pose a critical question of gaps in seasonal forecasting for quarterly data, a shortcoming covered by this study in benchmarking against Random Forest in CMHC completions. This paper addresses these gaps by comparatively examining ETS, SARIMA, and Random Forest in CMHC housing completions data and offers a stronger method to inform supply-side policies.
METHODOLOGY
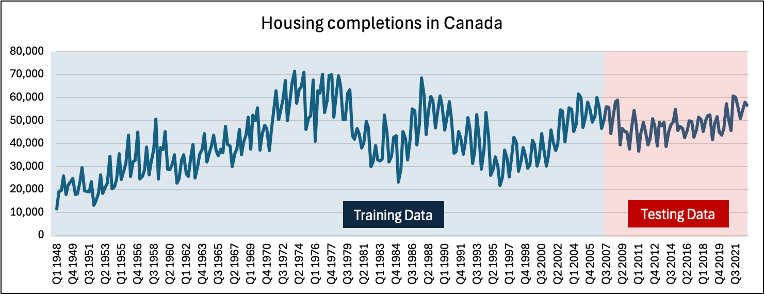
Housing completions data that was not seasonally adjusted from Statistics Canada was downloaded and then cleaned by transposing it into columns within excel. The data was divided into 2 segments in an 80:20 split, the first and larger segment being the training phase and the smaller segment being the testing phase. The training data was then loaded into EViews to implement various forecasting techniques to check viability.
Forecast Techniques
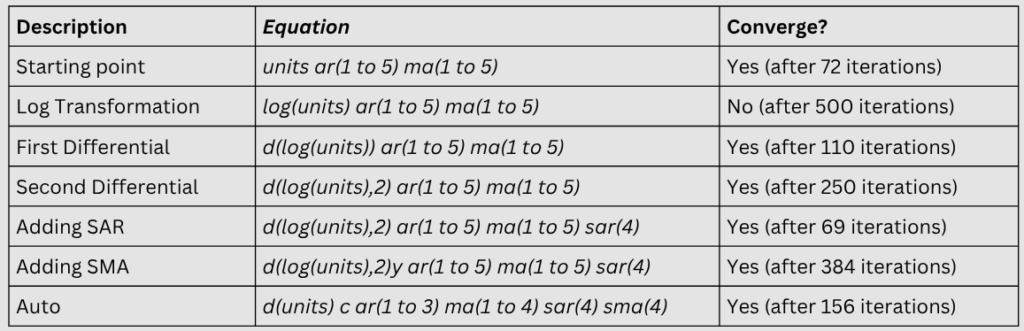
Forecast Technique #1: SARIMA
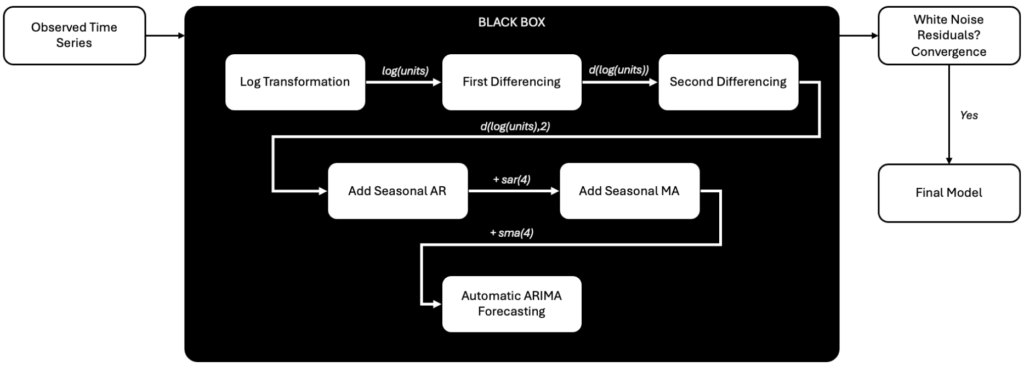
Table 1: Equations used in EViews for SARIMA forecast
Forecast Technique #1: ETS Model
Forecast Technique #3: Random Forest
The Random Forest model was implemented in R using the randomForest package with 500 trees (ntree = 500). Trees were grown fully without pruning, and bootstrap sampling with Out-of-Bag (OOB) error estimation was used for internal validation. The model was trained on lagged values (last four quarters) and forecasts beyond 2022 were generated recursively using these lags as inputs (ChatGPT Code in Appendix A and B)
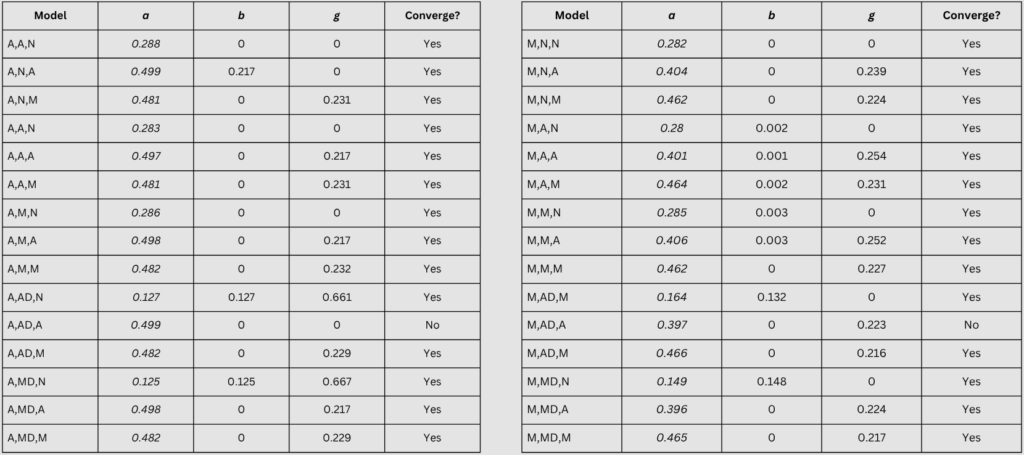
Forecast Technique #1: Winter-Holts
Randomised values were first employed within EViews. However, using python, constants were optimised for alpha (a) and Beta (b) and gamma (g). Later, optimized parameters were estimated within the auto feature on Eviews. However, the testing phase showed that this model is not a great fit for this data.
Confidence Interval Estimation
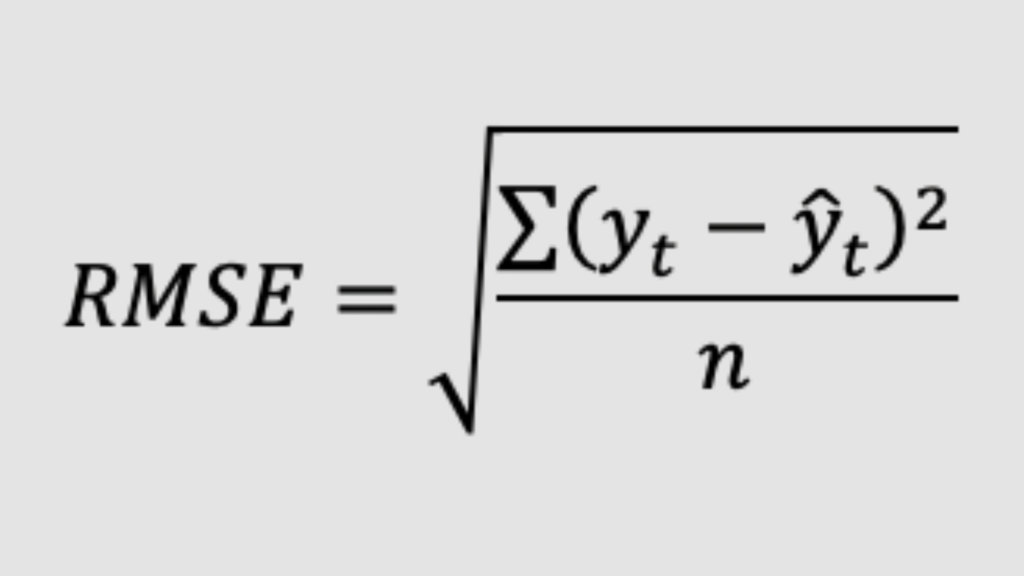
First the Root mean Square Error (RMSE) is calculated using the formula below:
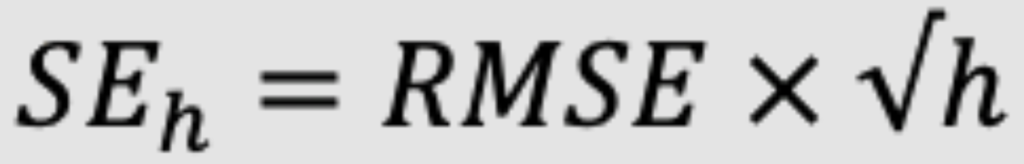
For horizon h, Standard Error (SEh) grows with √ℎ, a simple approximation would be
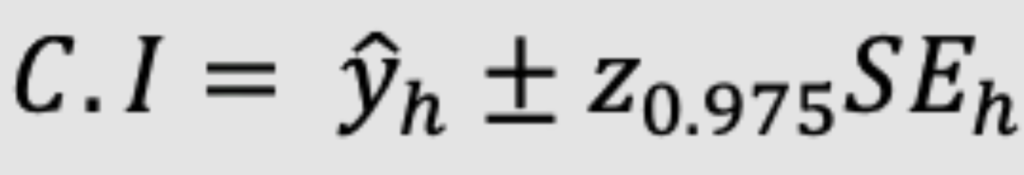
The confidence Interval band is given by the formula below
Calculating Metrics
Naïve Forecast is a good benchmark for forecast models 𝑦t = 𝑦t-1
Root Mean Square Error (RMSE) is calculated using the formula below
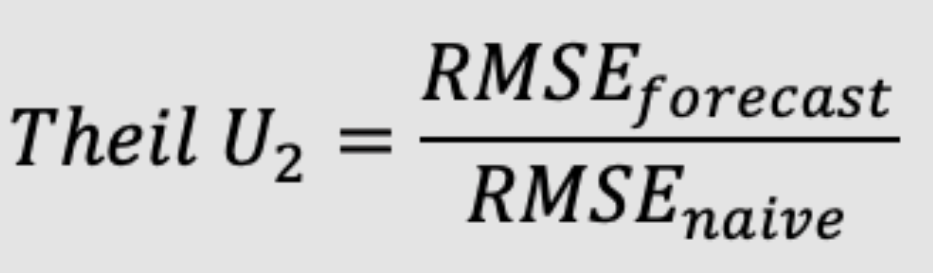
Theil’s U2 coefficient can be calculated by
DATA DESCRIPTION
The data was obtained from Statistics Canada, but is originally from Canada Mortgage and Housing Corporation (CMHC) and it has quarterly unadjusted data of housing starts, units under construction and completions from Q1 1948 to Q4 2022 however, the forecast that is conducted here however focuses on housing completions as it is a key macroeconomic indicator. 4 major categories of housing are a part of this data namely, i) Single-detached, ii) Semi-detached, iii) Row housing along with iv) Apartments and other unit types. This data is forecasting housing supply trends, real estate market analysis and policy making.
The data has clear cyclical, seasonal and trend components as shown in the figure below
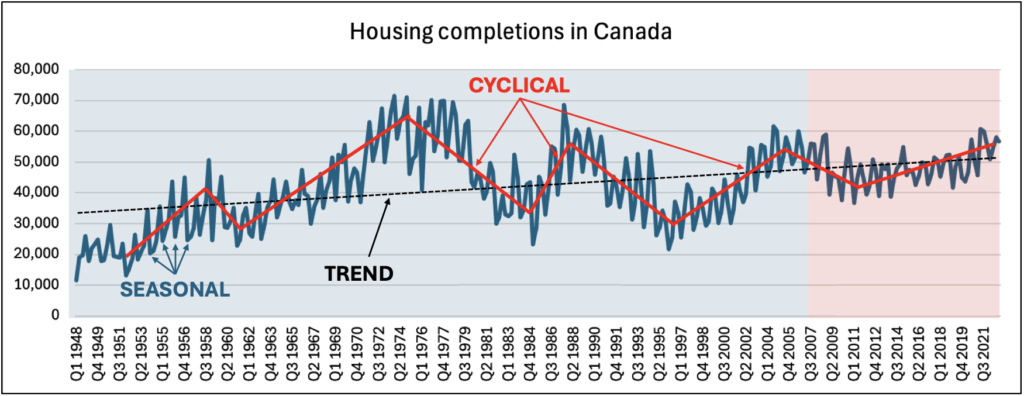
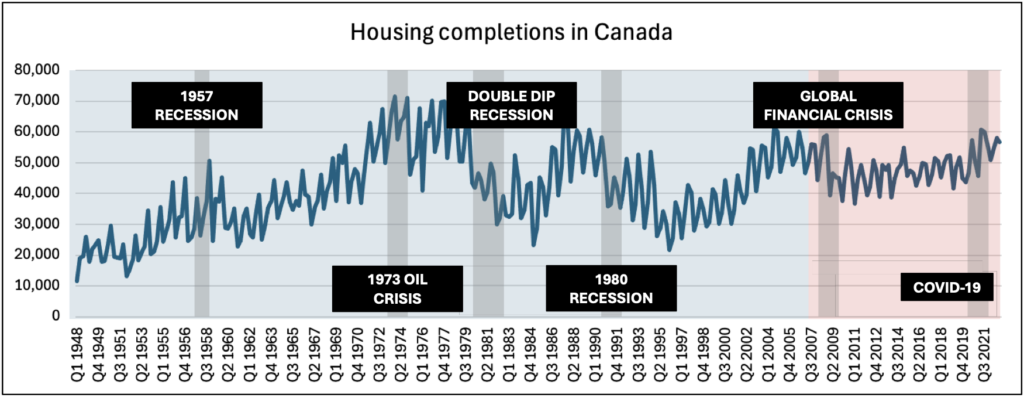
Since Housing completions are a lagging indicator of economic activity, throughout the economic cycles, it can be seen that the decline in the economy is sharply followed by the reduction in housing completions.
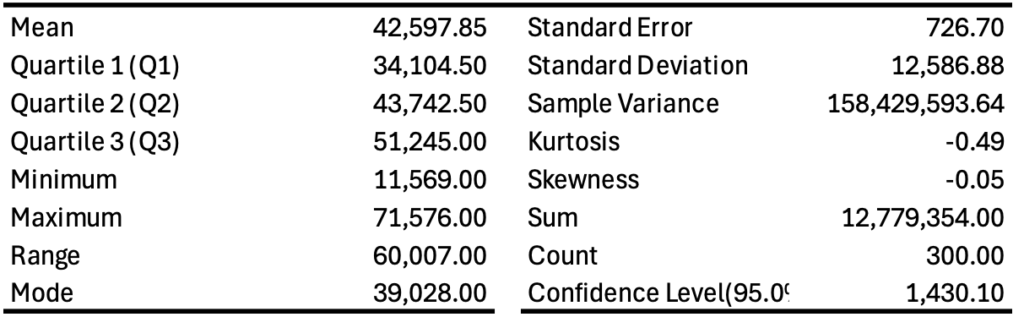
Over this 73-year window (Q1 1948 to 2022) housing completions average around 42,598 units per quarter, with a median near 43,743 units indicating that the distribution is only mildly right-skewed. Values range from a minimum just above 11,000 units (Y1948) to a maximum close to 71,000 units (late 1970s), giving an overall range of roughly 60,000 units. The estimated standard deviation is sizeable, approximately 12 000 units. First (Q1) and third quartiles (Q3) lie near 34,000 units and 51,000 units, respectively, yielding an inter-quartile range of about 17,000 units. Skewness is very close to zero hence the distribution is close to symmetric. A kurtosis of -0.49 shows that the distribution is platykurtic. These features make it reasonable for forecasting.
EMPIRICAL RESULTS
ARIMA (4,3)(2,1)
ARIMA (3,4)(1,1)
ETS (A,N,M)
ETS (A,N,A)
Random Forest (500 Trees)
Random Forest (500 Trees)
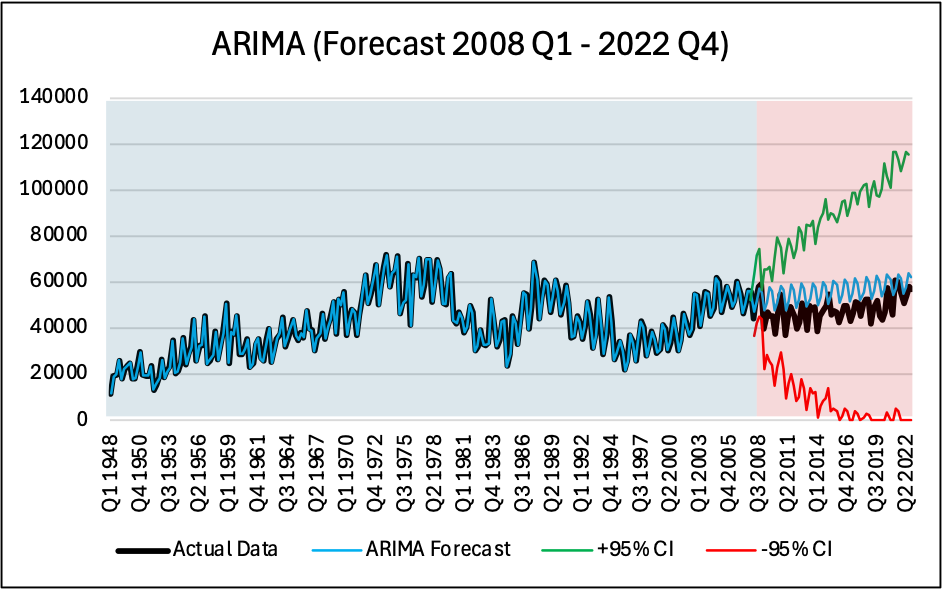
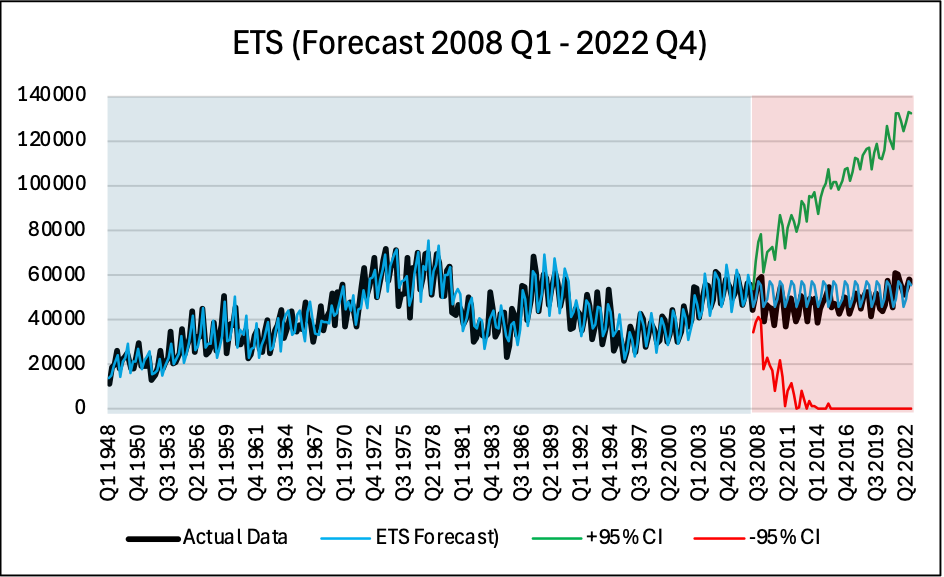
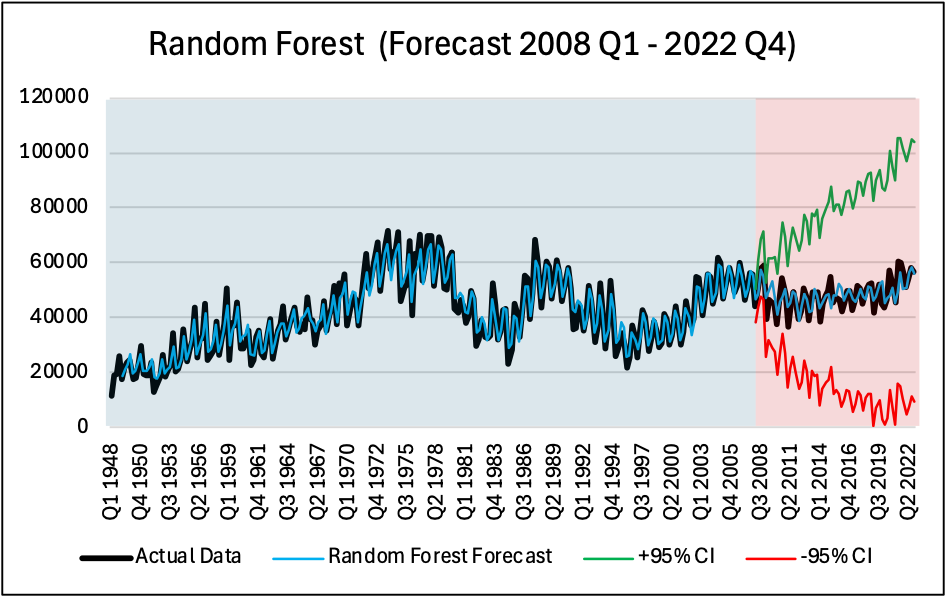
Using Training Data from Q1 1948 to Q4 2007, the following forecasts were obtained from Q1 2008 to Q4 2022, we can visually see the fit and how well these models perform outside of the training window.
Results from these three models were compared on the basis of Theil U2 coefficient and AIC values, additionally by superimposing the forecast results to the actual data in the testing stage, the results can by compared.
DISCUSSION
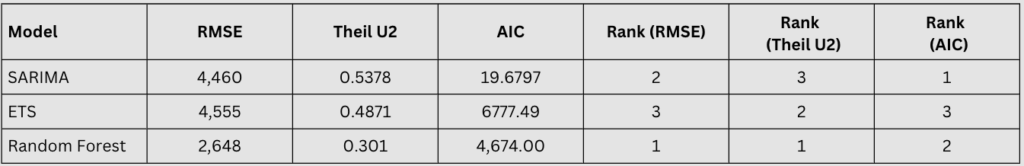
First, the models were estimated on 1948Q1–2007Q4 and then tested out of sample on 2008Q1–2022Q4. The top-performing model was the Machine learning method i.e. Random Forest (RF). Its RMSE was the lowest 2,648 and Theil’s U2 measure of 0.301 reflect substantive gains relative to a naïve benchmark and considerably reduced errors compared to the statistical baselines. SARIMA was the second-best as it reached RMSE of 4,460 and Theil’s coefficient U2 of 0.538, and finally, ETS yielded RMSE of 4,555 and U2 of 0.487. The test window included the Global Financial Crisis during 2008 and COVID interruptions during 2020. RF’s strength is its can handle non-linear, state-dependent dynamics from the lagged values, while the linear forms on SARIMA/ETS fail when the data switch between regimes.
Model selection diagnostics are also informative. ETS auto-selected A,N,A (additive error, no trend, additive seasonality), which corresponds with the strong quarterly pattern and mild long-run drift in completions. SARIMA’s chosen specification ((3,4)(1,1) on the differenced series) fits much of the serial dependence but shows an MA non-invertibility flag in EViews, likely contributing to less stable forecasts. While AIC was reported for all methods, it is not comparable across families (different likelihoods/variables), so ranking should rely on the out-of-sample errors, where RF is clearly superior.
Uncertainty quantification differs: ETS/ SARIMA yield principled confidence intervals from their state-space/likelihood frameworks; RF requires approximation (e.g., RMSE-based bands), which is acceptable for display but less interpretable. Practically, this suggests a division of labor: use RF for short-horizon point forecasts (2023–2025), and leverage ETS for transparent seasonal components and intervals.
The forecast results have clear implications for Canada’s ongoing housing affordability challenges. Random Forest projections indicate that completions will remain well below the levels required to close the national supply gap by 2025, suggesting persistent upward pressure on prices and continued barriers to entry for first-time buyers and immigrants. The model’s strength in capturing nonlinear, state-dependent patterns makes it valuable for short-term policy responses during economic shocks, while ETS and SARIMA’s interpretability offers policymakers and industry stakeholders clearer insights into seasonal construction cycles. A combined modelling approach could therefore support both rapid intervention planning and long-term strategic development. However, given the sector’s sensitivity to macroeconomic disruptions, such as interest rate hikes or trade policy changes, sustained increases in construction output will be necessary to prevent further deterioration in housing affordability.
CONCLUSION
This report compared three forecasting models namely SARIMA, ETS and Random Forest forecast for Canadian housing completions using publicly available data from 1948 Q1 to 2022 Q4. The best model by far was Random Forest as it had the lowest RMSE and Theil’s U2 parameter. The main reason being that Random forest can handle non-linearity better than traditional models. The results show that Random Forest Forecast estimates that by Q4 2025, there will be around 55,360 newly completed houses in Canada. SARIMA has the second lowest RMSE and performed well with the forecast, this method predicts 57,532 houses completed which is slightly higher than the Random Forest forecast. Lastly, ETS forecasting performed the worst however it took into account seasonality and it forecasts 56,069 houses completed which lies in between the Random Forest and the SARIMA forecasts
FUTURE RESEARCH
First, replace the single 80/20 split with walk-forward (rolling) validation so every model is tested across many start dates; a simple Diebold–Mariano check can confirm if error differences are real. Second, add business drivers, building permits/starts, mortgage rates, unemployment, immigration, materials costs, and policy changes and estimate explainable models such as seasonal regressions or ARIMA with exogenous inputs. Third, keep Random Forest but compare it with gradient boosting and a regularized linear model, tuning all of them with the same rolling validation. Fourth, provide clearer risk bounds by creating bootstrap or quantile-based prediction intervals and verifying that 80%/95% of actuals fall inside. Fifth, build regional (province/CMA) forecasts and reconcile up to the national total to improve accuracy and policy relevance. Finally, automate a quarterly pipeline that ingests new data, re-trains, updates charts/tables, and runs simple “what-if” scenarios for rates or immigration.
REFERENCES
CMHC, C. M. and H. C. (2025, April 28). Canada Mortgage and Housing Corporation, housing starts, under construction and completions, all areas, quarterly. Government of Canada Statistics. https://doi.org/10.25318/3410013501-eng
CREA, T. C. R. E. A. (2025, July 15). CREA Updates Resale Housing Market Forecast Amid Continuing Economic Uncertainty. CREA. https://www.crea.ca/housing-market-stats/canadian-housing-market-stats/quarterly-forecasts/
Farhan, B. Y. (2024). Canada’s leadership and housing affordability: Evidence from the Canadian real estate market. Journal of Urban Management, 13(1), 52–61. https://doi.org/10.1016/j.jum.2023.11.001
Mohamed, H. H., Ibrahim, A. H., & A. Hagras, O. (2023). Forecasting the Real Estate Housing Prices Using a Novel Deep Learning Machine Model. Civil Engineering Journal, 9, 46–64. https://doi.org/10.28991/CEJ-SP2023-09-04
PwC Canada. (2025). Emerging Trends in Canadian Real Estate 2025. Canadian Real Estate Report 2025. https://www.pwc.com/ca/en/industries/real-estate/emerging-trends-in-real-estate.html
Yang, J., Lao, H., MacIsaac, M., & Brannlund, J. (2023). Predicting Changes in Canadian Housing Markets with Machine Learning. Bank of Canada.
Zhan, C., Liu, Y., Wu, Z., Zhao, M., & Chow, T. W. S. (2023). A hybrid machine learning framework for forecasting house price. Expert Systems with Applications, 233, 120981. https://doi.org/10.1016/j.eswa.2023.120981